Curve (CRV/USD) Gains Bullish Momentum: Breaking Through Key Resistance Level
Estimated Reading Time: 3 minutes
Don’t invest unless you’re prepared to lose all the money you invest. This is a high-risk investment and you are unlikely to be protected if something goes wrong. Take 2 minutes to learn more
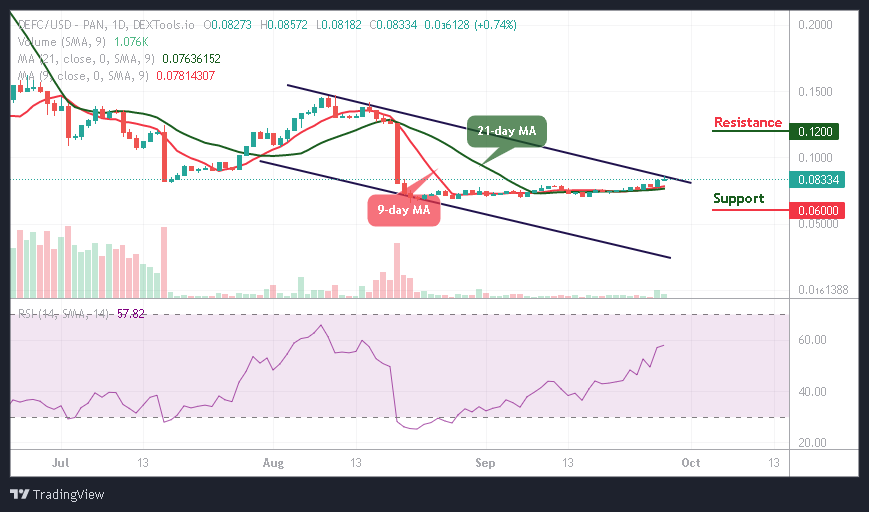
The Curve (CRV) market has been trading around the $0.25 price level since October. However, after establishing support at $0.22, the market began to gain steady upward momentum, ultimately breaking through the longstanding resistance at $0.30. This breakthrough has spurred increased bullish sentiment, driving the market further upward. To gain deeper insights, let’s analyze the indicators.
The Curve Market Data
- CRV/USD Price Now: $0.318
- CRV/USD Market Cap: $388 million
- CRV/USD Circulating Supply: 1.22 billion CRV
- CRV/USD Total Supply: 2.19 billion CRV
- CRV/USD CoinMarketCap Ranking: #156
Key Levels
- Resistance: $0.35, $0.40, and $0.50
- Support: $$0.25, $0.20, and $0.19
The Curve Market Through the Lens of Indicators
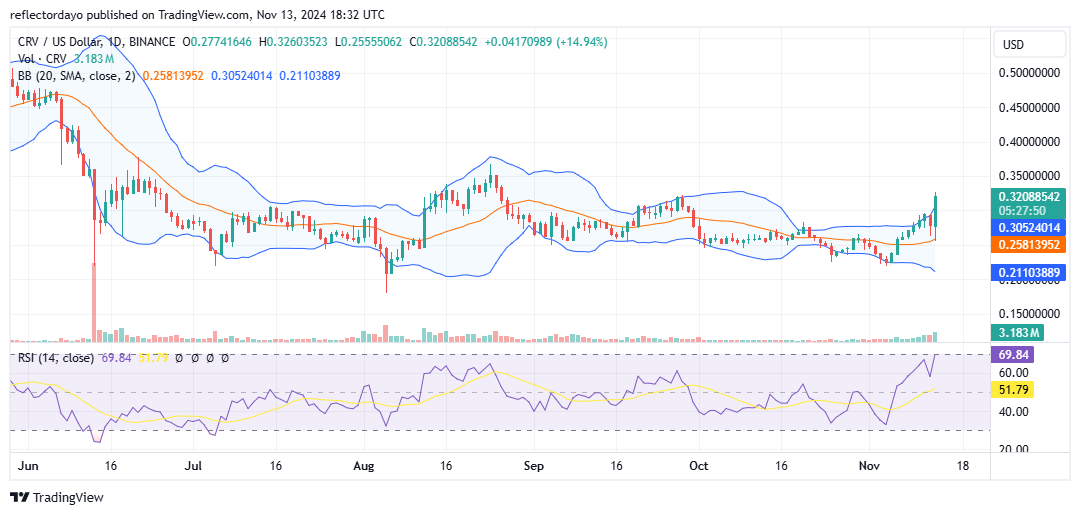
Today’s bullish candlestick reflects a volatile crypto signal where bears initially held control, but bulls gained momentum around the $0.26 price level, driving the price upward and breaking the critical resistance at $0.30. This breakout has sparked further bullish sentiment. The small upper shadow on today’s candlestick suggests that bulls remain in control, signaling a possible continuation of the bullish trend.
However, the widening bandwidth of the Bollinger Bands indicator suggests increasing volatility in the curve market, which may empower bears if the market encounters a significant bearish resistance level. In the event of a correction, the $0.30 level may act as a support, potentially keeping the market buoyant above this level and favoring upward movement.
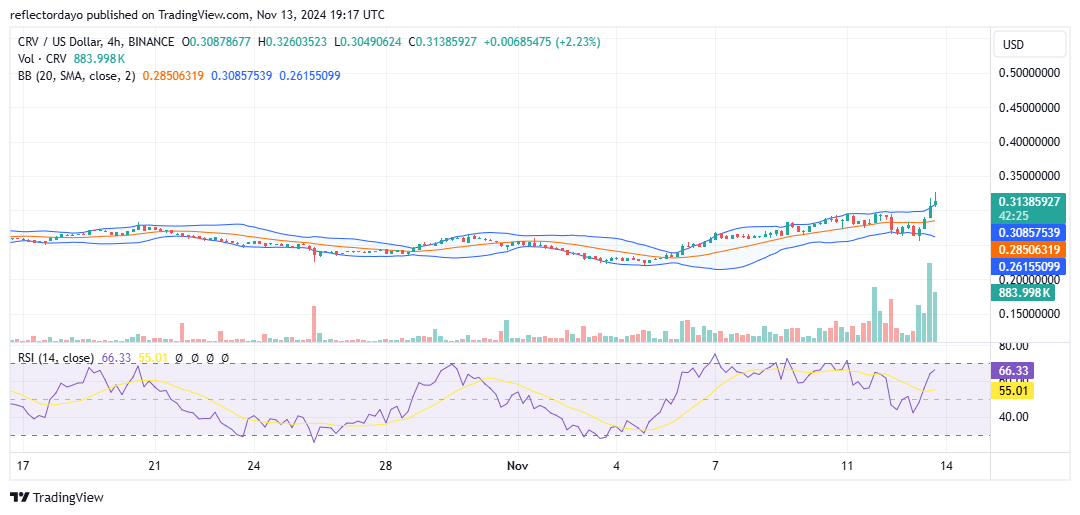
CRV/USD Price Prediction: 4-Hour Chart Analysis
On a smaller timeframe, we observe a steady bullish price trend, supported by significant trading activity as indicated by the prominent volume candlesticks. A major resistance level is emerging at $0.326, and the upper shadows on recent candlesticks suggest that the market may be undergoing a correction, signaling a potential downward turn. Investors should watch the $0.30 price level as a possible reentry point for a bullish position. Given the recent uptick in the volume histogram, there is a strong possibility that the market could rebound off the $0.30 support level and continue upward.