BNB (BNB/USDT) Bullish Traders May Flood the Market Soon
Estimated Reading Time: 3 minutes
Don’t invest unless you’re prepared to lose all the money you invest. This is a high-risk investment and you are unlikely to be protected if something goes wrong. Take 2 minutes to learn more
BNB Long-term Analysis: Bullish
BNB against the Tether has shown consistent bullish momentum in recent weeks, trading above major indicators. The pair has grown significantly since 2024, with occasional spikes and dips in price levels.
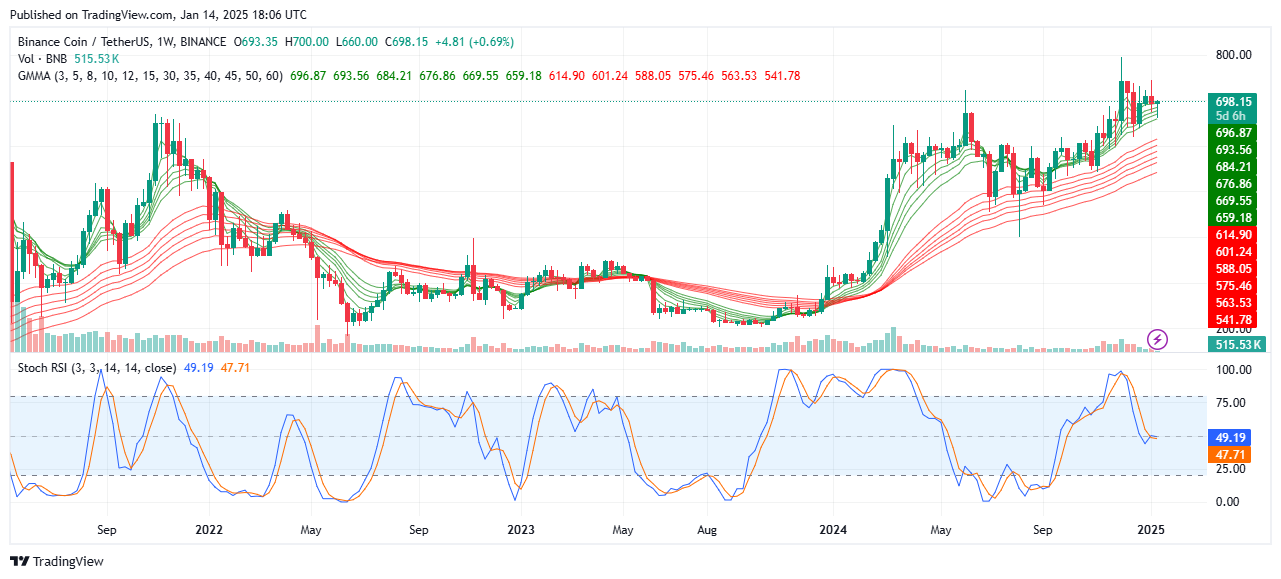
Recently, BNB/USDT appears to have been in a strong uptrend after a prolonged consolidation phase, and the Guppy Multiple Moving Averages (GMMAs) are trending upward indicating a sustained bullish momentum. Additionally, the volume bar within the chart has no spike indicating steady participation in the market. To this end, bullish traders must re-enter the market to maintain an uptrend, as the Stochastic RSI indicates potential consolidation in the near term.
Currently, BNB/USDT trades at $698.15 with a 0.69% positive change in trade from the previous session.
Technical Indicators
Major Resistance Levels: $700, $750, and $800
Major Support Levels: $659, $614, and $575
BNB Technical Analysis
The analysis of BNB against the Tether on the weekly timeframe reflects a strong bullish trend as the pair sees steady growth toward the $700 resistance level. Though the GMMAs indicate a short-term upside toward the immediate resistance level, the oscillator at the bottom of the chart shows the market lacks direction.
To this end, BNB has the potential to advance to the North with a break above the $700 psychological level; otherwise, a spike in the volume with more bearish actions might pull the price below $659.
BNB/USDT Analysis: What to Expect
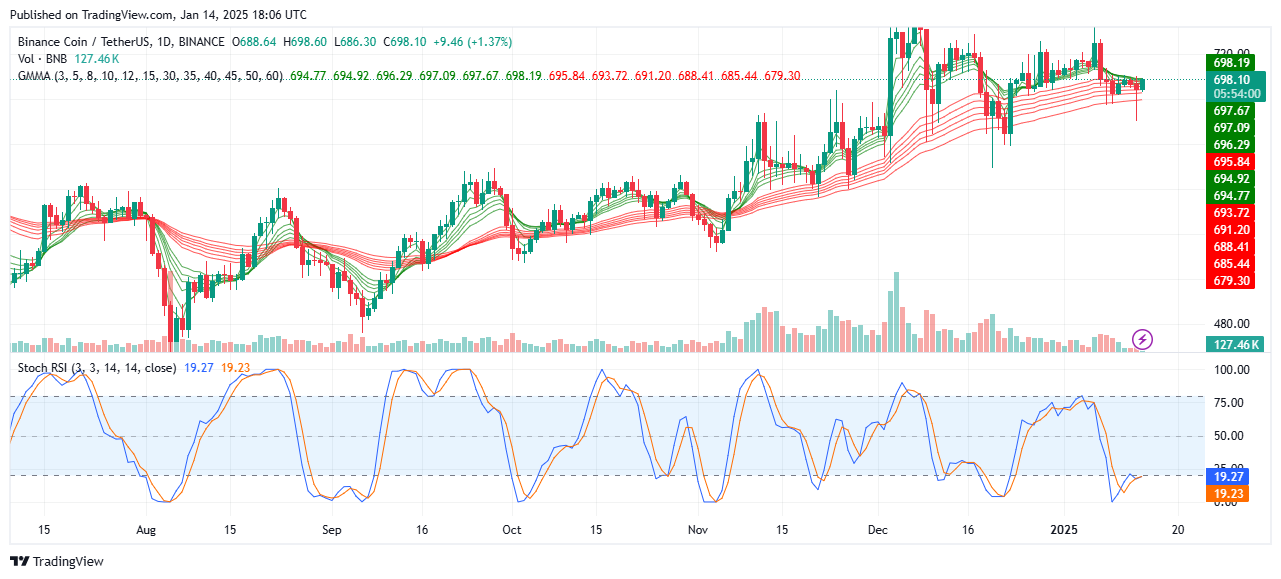
On the daily timeframe, BNB/USDT is consolidating despite recording a 1.37% gain above the previous session. However, as the pair oscillates near its near height, the sets of EMAs seem to be converging pointing at the indecision among the bulls and the bears.
On the other hand, the oscillator beneath the chart shows the pair operates deep in the oversold region, suggesting BNB could see a short-term bounce if buying pressure increases.
To this end, traders should watch out for price actions around the $700 level; a break above this level might see the price operating near $715 in the near term. Conversely, a break below the abovementioned level would suggest range-bound activities till a major spike in volume is observed.
You can purchase crypto coins here. Buy LBlock