Ripple (XRP) Retraces to an Oversold Region at $0.70, Upward Move Likely
Estimated Reading Time: 2 minutes
Don’t invest unless you’re prepared to lose all the money you invest. This is a high-risk investment and you are unlikely to be protected if something goes wrong. Take 2 minutes to learn more
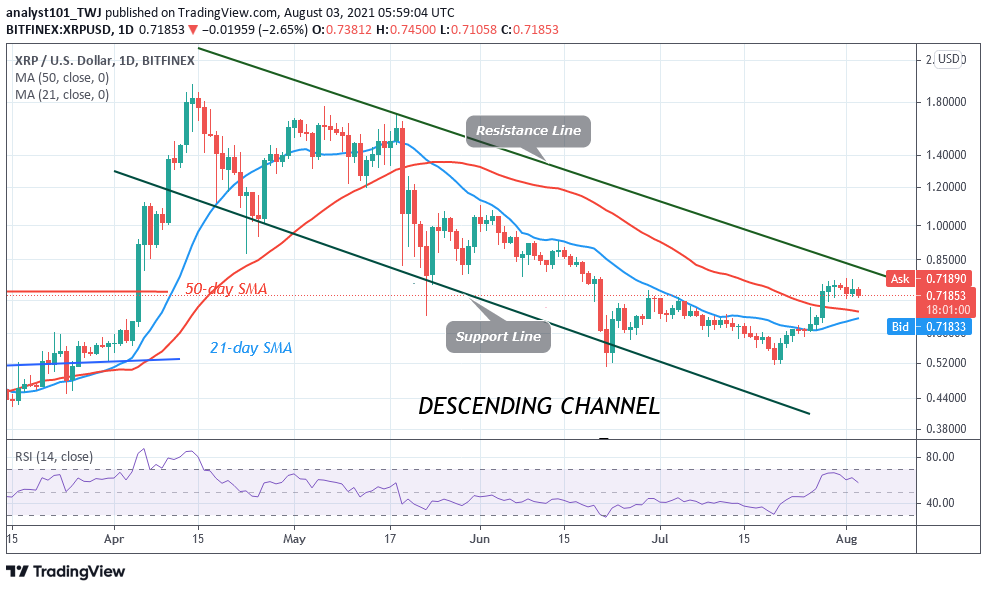
Ripple (XRP) Long-Term Analysis: Bearish
Ripple (XRP) has fallen to the low of $0.71 after rejection from the high of $0.76.The bulls have been retesting the $0.76 resistance to breaking above it. Today, the XRP price has broken below the moving averages suggesting that the altcoin will further decline on the downside. The downtrend is likely to extend to $0.60 low. On the other hand, if XRP retraces and finds support above the moving averages, XRP will résumé a fresh uptrend. Today, there is a bullish candlestick above the $0.7100 support. The uptrend will resume if the current support holds.
Ripple (XRP) Indicator Analysis
XRP price is above the moving averages. The uptrend will resume if the price bars are above the 21-day and the 50-day SMA. The altcoin is at level 58 of the Relative Strength Index period 14. It indicates that XRP is in the bullish trend zone above the centerline 50. Ripple is below the 20% range of the daily stochastic. XRP is in a bearish momentum and it has reached the oversold region. The 21-day and the 50-day SMAs are sloping downward indicating the downtrend.
Technical indicators:
Major Resistance Levels – $2.00, $2.50, $3.00
Major Support Levels – $1.50, $1.00, $0.50
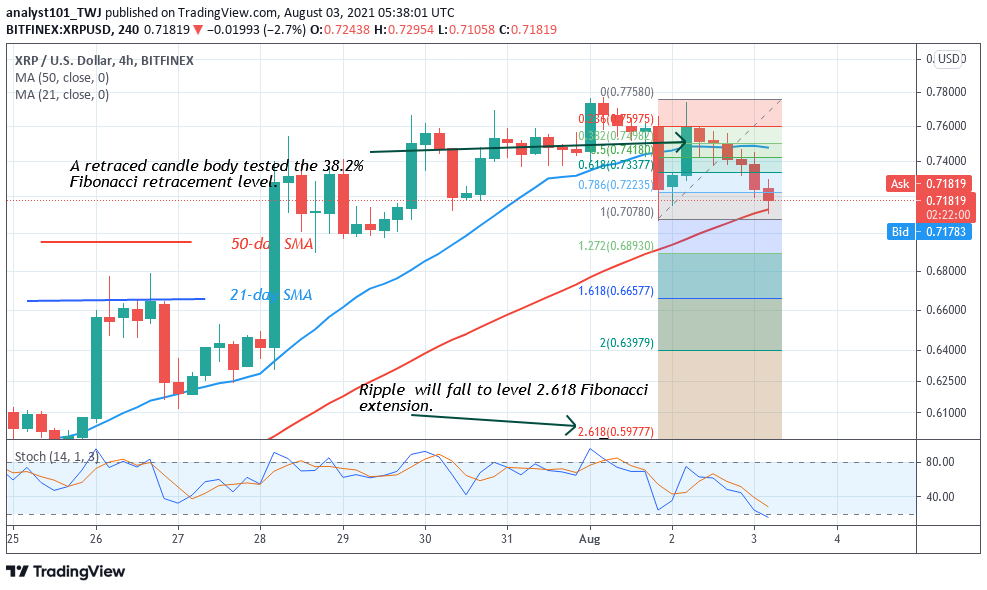
What Is the Next Direction for Ripple (XRP)
Ripple’s (XRP) price is in a downward move. The selling pressure may not continue as price reaches the oversold region. Meanwhile, on July 26 uptrend; a retraced candle body tested the 38.2% Fibonacci retracement level. The retracement indicates that Ripple is likely to rise to level 2.618 Fibonacci extension or level $0.59. From the price action, the market has declined to $0.71.
You can purchase crypto coins here. Buy Tokens
Note: Cryptosignals.org is not a financial advisor. Do your research before investing your funds in any financial asset or presented product or event. We are not responsible for your investing results