Bitcoin Remains In Aggressive Sideways Pattern as BTC Loses Correlation to Stocks
Estimated Reading Time: 3 minutes
Don’t invest unless you’re prepared to lose all the money you invest. This is a high-risk investment and you are unlikely to be protected if something goes wrong. Take 2 minutes to learn more

Free Crypto Signals Channel
At press time, BTC traded at $29,100, up by 0.31% on the day but down by over 3% in the last seven days. The flagship cryptocurrency has traded with a sideways pattern for about two weeks.
Bitcoin also trades down by over 58% from its all-time high of $69,000 recorded last November. As a result of the persistent bearish drive, Bitcoin’s Fear and Greed Index has oscillated between “fear” and “extreme fear” for most of the second quarter of 2022.
Meanwhile, reports show that BTC has decoupled from the stock market after remaining bullish as Wall Street recovered significantly last week.
Despite all this, a leading crypto analyst on Glassnode, Kripto Mevsimi, revealed in a report that 55% of all BTC are in profit.
Altcoins have suffered a similar fate to Bitcoin as most other cryptocurrencies recorded multi-month lows, amid the persisting multidimensional bearish market.
Key Bitcoin Levels to Watch — May 29
Bitcoin remains in an aggressively choppy pattern, as highlighted by the range on the 4-hour chart. The benchmark cryptocurrency fell to the $28,000 low last week, briefly negating the range, before rebounding towards the $29,500 area. After another attempt at the $28,000 support, BTC is now on the verge of a return above the $29,500 mark.
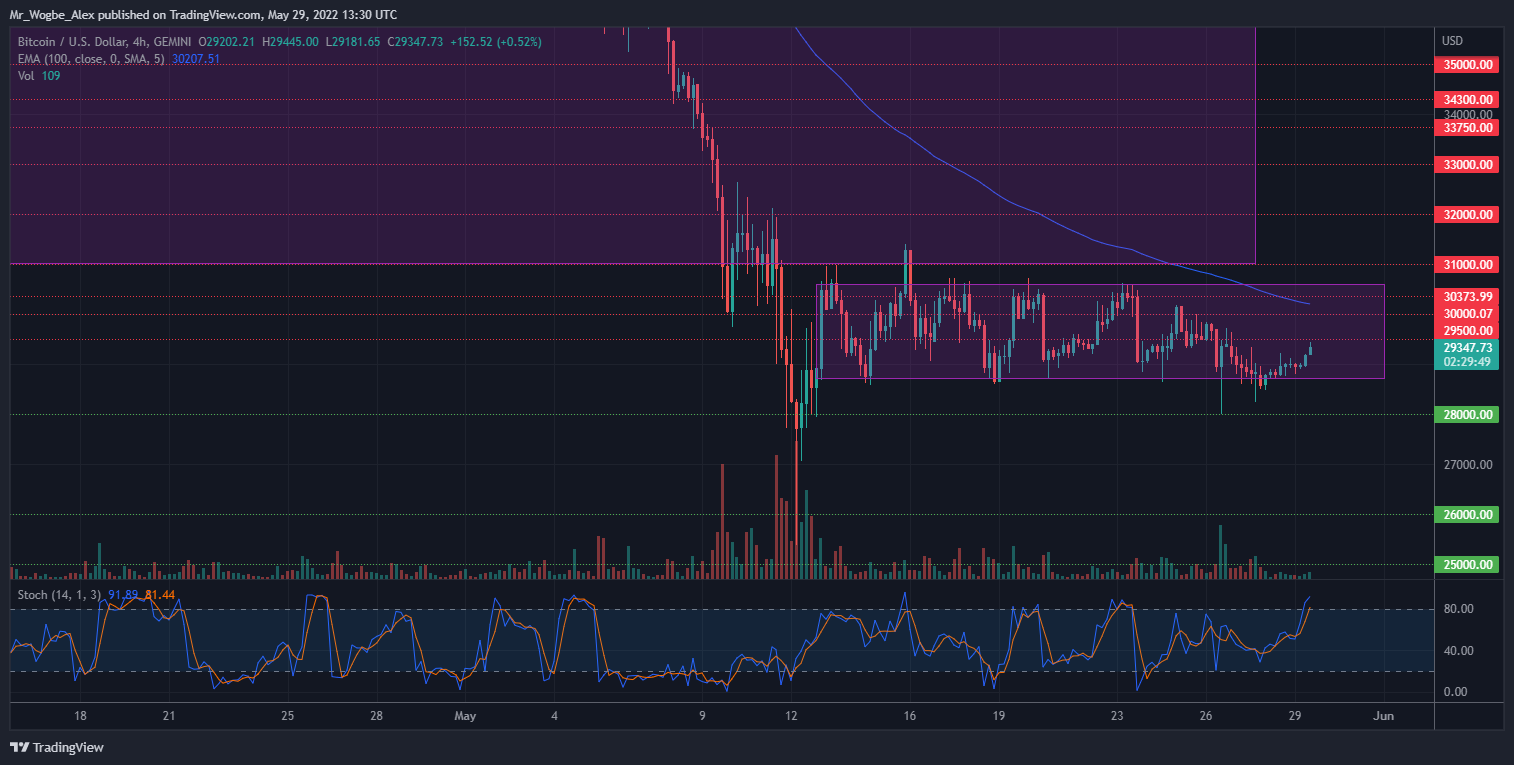
That said, the critical level for a bullish return is the $31,000 mark, which remains out of reach for bulls at the moment. The price dynamics recorded when BTC taps the $30,000 mark (100 EMA) again should determine the chances of a retest of $31,000.
Meanwhile, my resistance levels are at $30,000, $30,600, and $31,000, and my key support levels are at $29,000, $28,700, and $28,000.
Total Market Capitalization: $1.22 trillion
Bitcoin Market Capitalization: $558.9 billion
Bitcoin Dominance: 45.7%
Market Rank: #1
You can purchase Lucky Block here. Buy LBlock