Chainlink Breaks Crucial Support at $13, May Revisit the Previous Low at $11
Estimated Reading Time: 3 minutes
Don’t invest unless you’re prepared to lose all the money you invest. This is a high-risk investment and you are unlikely to be protected if something goes wrong. Take 2 minutes to learn more

Free Crypto Signals Channel
Chainlink (LINK) Long-Term Analysis: Bearish
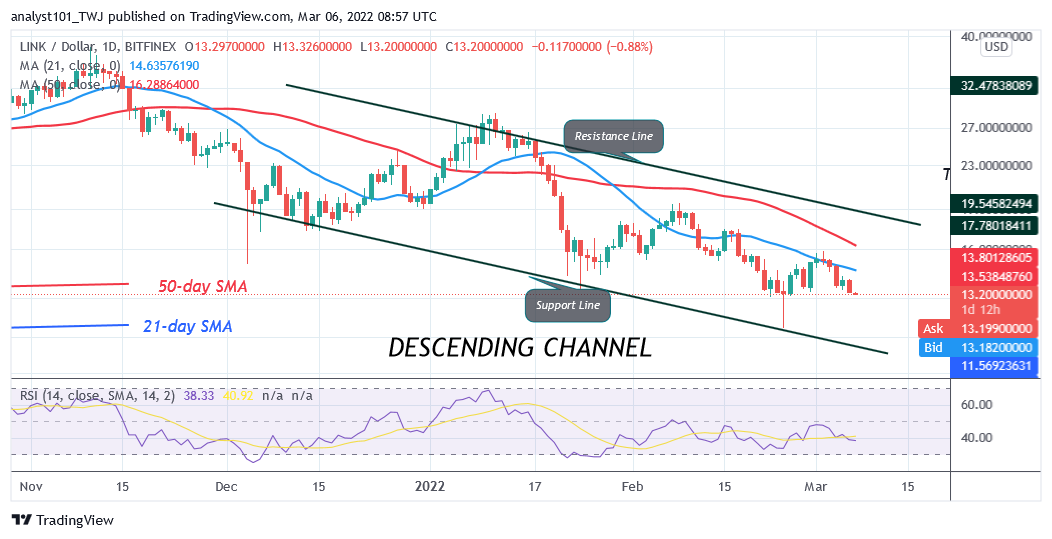
Chainlink’s (LINK) price is in a downtrend but may revisit the previous Low at $11. The $13 support is the historical price level of the January 22 price slump. Chainlink is likely to hold above the support. The $13 historical price level has been holding since July 21, 2021. If the current support holds, Chainlink will rise and retest the resistance at $19. A break above the resistance will catapult the altcoin above the moving averages. The bullish momentum will reach the high of $28. On the downside, the current support is likely to hold. On February 24, the market declined to an oversold region at the low of $11. Buyers emerged and pushed the altcoin above the previous low at $13.
Chainlink (LINK) Indicator Analysis
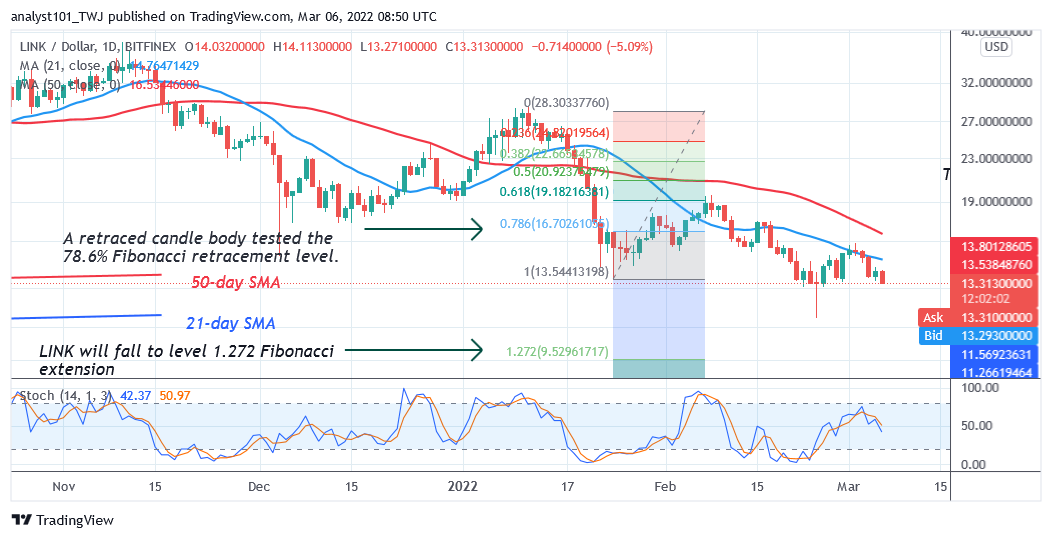
Chainlink is at level 36 of the Relative Strength Index Period 14. The altcoin has fallen to the downtrend zone and is approaching the oversold region of the market. The crypto’s price is below the 21-day SMA and the 50-day SMA indicating a possible fall. The 21-day SMA and the 50-day SMA are sloping southward indicating the downtrend. Chainlink is in a bearish momentum below the 50% range of the daily stochastic.
Technical indicators:
Major Resistance Levels – $40.00, $42.00, $44.00
Major Support Levels – $26.00, $24.00, $22.00
What Is the Next Direction for Chainlink (LINK)?
Chainlink is in a downtrend but may revisit the previous low at $11. The cryptocurrency is likely to revisit the lows of $11 and $9 price levels. Meanwhile, on January 11 downtrend; a retraced candle body tested the 78.6 % Fibonacci retracement level. The retracement suggests that LINK will fall to level 1.272 Fibonacci extension or $9.52. From the price action, the altcoin has fallen to the low of $12.
You can purchase crypto coins here. Buy LBlock
Note: Cryptosignals.org is not a financial advisor. Do your research before investing your funds in any financial asset or presented product or event. We are not responsible for your investing results