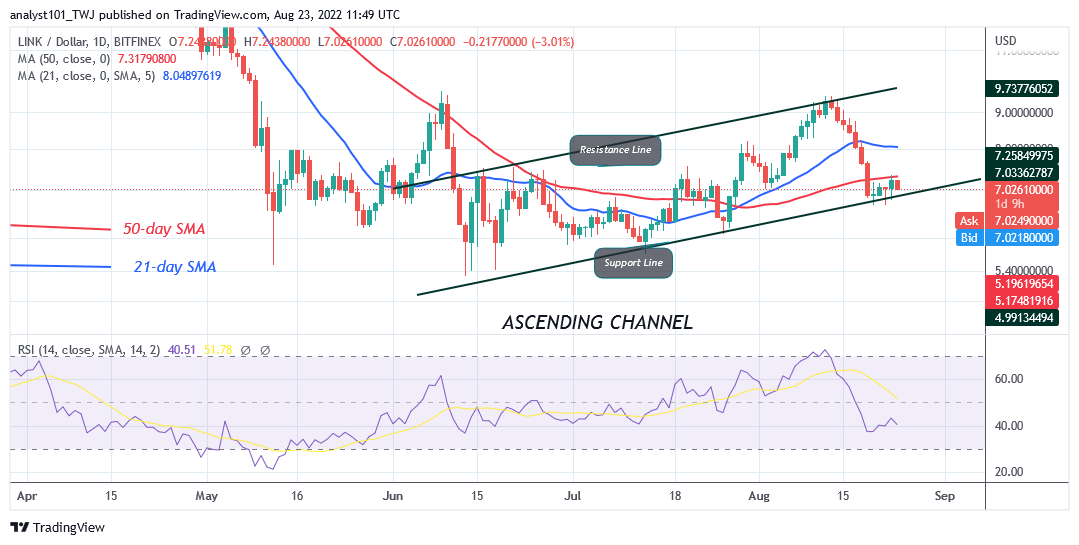
Chainlink Declines as It Fails to Sustain Above the $7.35 High
Estimated Reading Time: 2 minutes
Don’t invest unless you’re prepared to lose all the money you invest. This is a high-risk investment and you are unlikely to be protected if something goes wrong. Take 2 minutes to learn more

Free Crypto Signals Channel
Chainlink(LINK) Long-Term Analysis: Bearish
Chainlink’s (LINK) price is now in a downward correction as it fails to sustain above the $7.35 high. The altcoin has fallen below the moving average lines to the low of $6.82 as bulls bought the dips. The upward move is facing rejection at the 50-day line SMA. The bottom line is that the altcoin risks further decline as price bars are below the moving average lines. On the downside, if the bears break below the $6.82 support, the market will further decline to the low of $5.70 price level. In the meantime, Chainlink is fluctuating below the 50-day line SMA as bulls attempt to break above it.
Chainlink (LINK) Indicator Analysis
Chainlink is at level 41 of the Relative Strength Index for period 14. The coin is in the bearish trend zone and may decline. LINK’s price bars are below the moving average lines which indicates further decline. The altcoin is below the 40% range of the daily stochastic. It indicates that the market is in a bearish momentum.
Technical indicators:
Major Resistance Levels – $18.00, $20.00, $22.00
Major Support Levels – $8.00, $6.00, $4.00
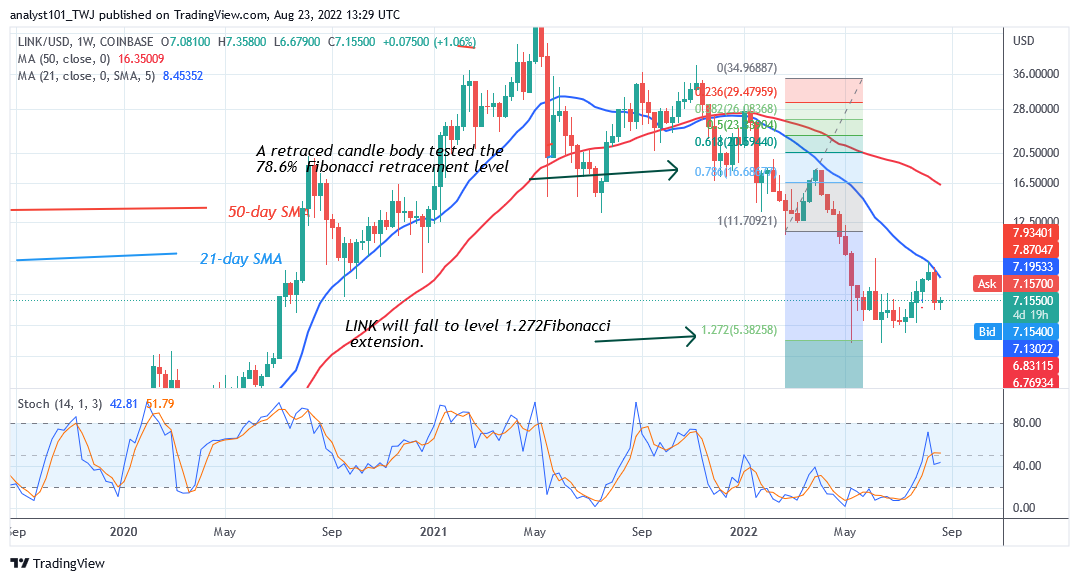
What Is the Next Direction for Chainlink (LINK)?
Chainlink is in a downward move and may decline as it fails to sustain above the $7.35 high. On a weekly chart, a retraced candle body tested the 78.6% Fibonacci retracement level on March 28. The retracement suggests that LINK will fall to level 1.272 Fibonacci extension or $5.38.
You can purchase crypto coins here. Buy LBLOCK
Note: Cryptosignals.org is not a financial advisor. Do your research before investing your funds in any financial asset or presented product or event. We are not responsible for your investing results