Chainlink Enters the Oversold Region as It Rebounds Above $11.00
Estimated Reading Time: 3 minutes
Don’t invest unless you’re prepared to lose all the money you invest. This is a high-risk investment and you are unlikely to be protected if something goes wrong. Take 2 minutes to learn more

Chainlink (LINK) Long-Term Analysis: Bearish
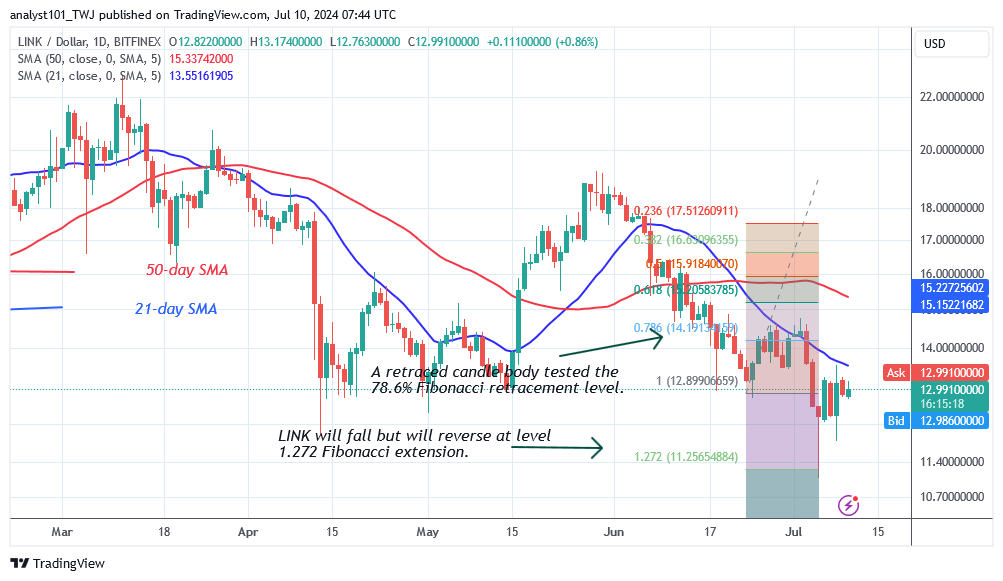
Chainlink’s (LINK) price has reached bearish exhaustion as it rebounds above $11.00. On July 5, the LINK price fell to a low of $11.07 before pulling back to start a range-bound move between $12 support and below the moving average lines. In the last five days, the altcoin has fluctuated in anticipation of a trend. During the June 23 price decline, a retraced candle body tested the 78.6% Fibonacci retracement level.
The correction means the LINK price will decline before reversing at the 1.272 Fibonacci extension. The cryptocurrency asset has plummeted and retreated as it resumed its upward trajectory. On the negative, an additional decrease in the cryptocurrency is doubtful, as the price indication shows a probable reversal at $11.25.
On the upside, the uptrend will begin whenever the price breaks above the moving average lines. Chainlink is now trading at $12.92 as of this writing.
Technical indicators:
Major Resistance Levels – $20.00, $22.00, $24.00
Major Support Levels – $12.00, $10.00, $8.00
Chainlink (LINK) Indicator Analysis
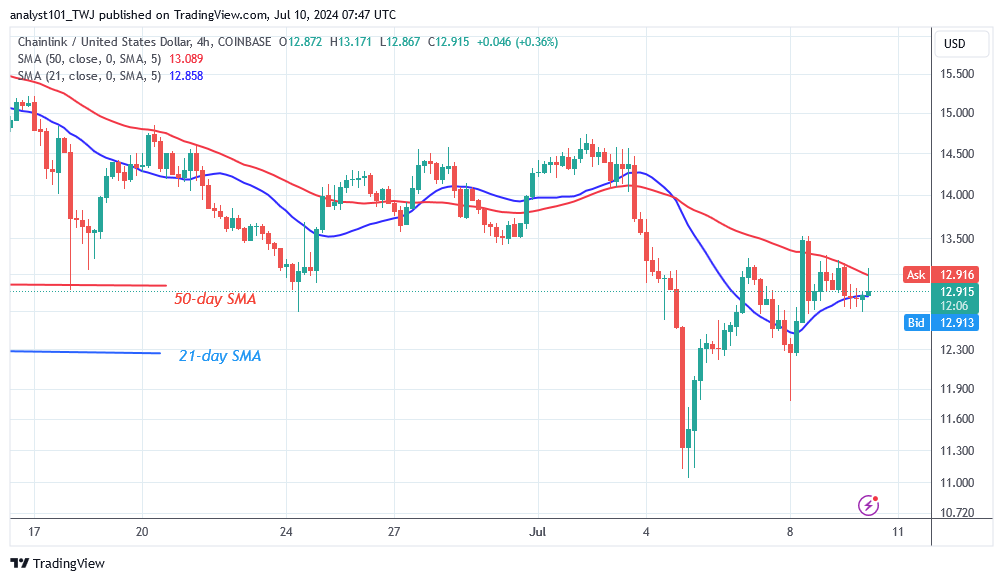
Chainlink has slipped to the oversold sector of the market as the altcoin pulled back, leaving a long candlestick tail near the $11.00 support level. The lengthy candlestick represents significant buying pressure at the $11 support. On the 4-hour chart, the altcoin will be forced to move in a range because it is trapped between the moving average lines.
What Is the Next Direction for Chainlink (LINK)?
On the 4-hour chart, the crypto asset is in a range-bound move as it rebounds above $11.00. The altcoin is currently trading between $11 and $13.50, below the barrier level. The price movement is currently caught between the moving average lines, resulting in a delay in the cryptocurrency’s trend. Meanwhile, the crypto signal is range-bound because it is caught between the moving average lines.
You can purchase Lucky Block here. Buy LBLOCK
Note: Cryptosignals.org is not a financial advisor. Do your research before investing your funds in any financial asset or presented product or event. We are not responsible for your investing result.