Chainlink Is Falling as It Approaches the Previous Low of $6.80
Estimated Reading Time: 2 minutes
Don’t invest unless you’re prepared to lose all the money you invest. This is a high-risk investment and you are unlikely to be protected if something goes wrong. Take 2 minutes to learn more
Chainlink (LINK) Long-Term Analysis: Bullish
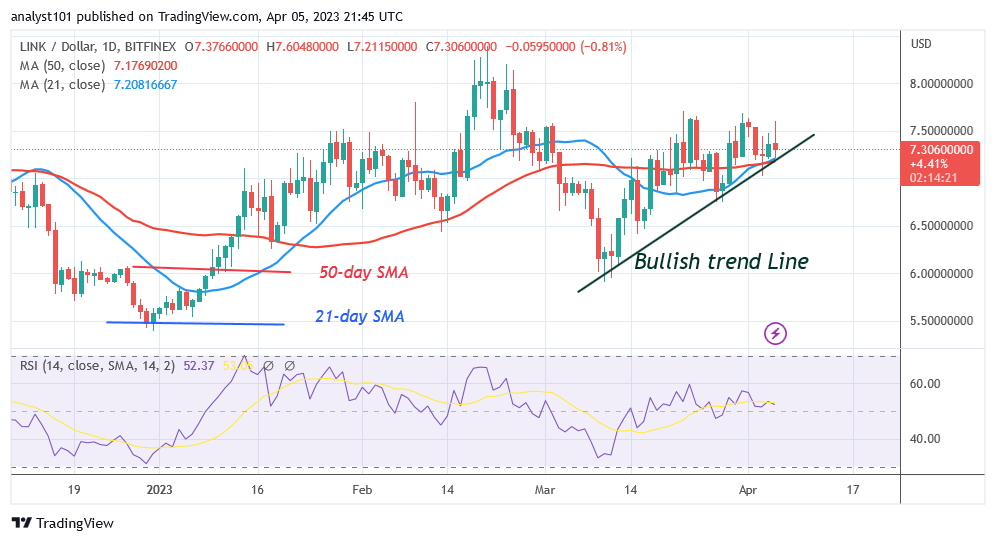
Chainlink (LINK) price is still in the bullish trend zone but risks decline to the previous low of $6.80. In the previous price movement, Chainlink was trading above the moving average lines but below the $7.60 resistance level. Buyers were unable to continue the upward trend since they failed to hold their position above the most recent high. LINK is currently trading at $7.21 between the moving average lines. The crypto asset will be compelled to move in a range if it becomes stuck between the moving average lines. On the other hand, LINK’s price will drop back to its previous low of $6.80 if it breaks below the moving average lines.
Chainlink (LINK) Indicator Analysis
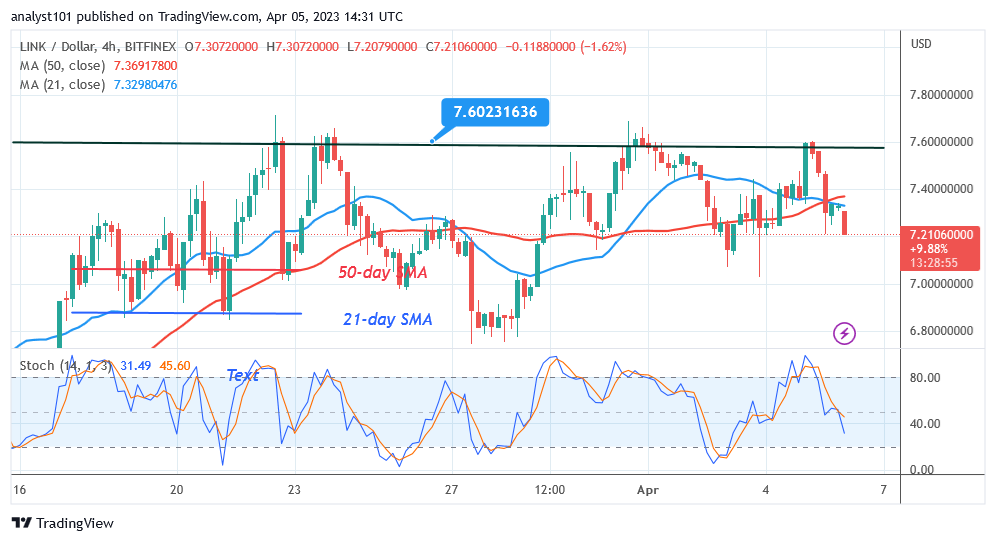
During period 14, Chainlink is at level 52 of the Relative Strength Index. The altcoin is in a good trend zone, thus there is room for big growth. The price bars for LINK show a range-bound movement of the coin because they are situated between the moving average lines. The crypto asset is in a bearish momentum below level 40 of the daily Stochastic.
Technical indicators:
Major Resistance Levels – $18.00, $20.00, $22.00
Major Support Levels – $8.00, $6.00, $4.00
What Is the Next Direction for Chainlink (LINK)?
Chainlink fluctuates above the moving average lines but risks decline to the previous low of $6.80.The drop will continue till the previous low, which is $7.00 or $6.80. LINK/USD will trade in a range between $6.80 and $7.60 if the current support holds. The altcoin has been fluctuating within a constrained range since March 22.
You can purchase crypto coins here. Buy LBLOCK
Note: Cryptosignals.org is not a financial advisor. Do your research before investing your funds in any financial asset or presented product or event. We are not responsible for your investing results