Chainlink (LINK) Faces Rejection at $32, Targets the $4.78 Low
Estimated Reading Time: 2 minutes
Don’t invest unless you’re prepared to lose all the money you invest. This is a high-risk investment and you are unlikely to be protected if something goes wrong. Take 2 minutes to learn more
Chainlink (LINK) Long-Term Analysis: Bearish
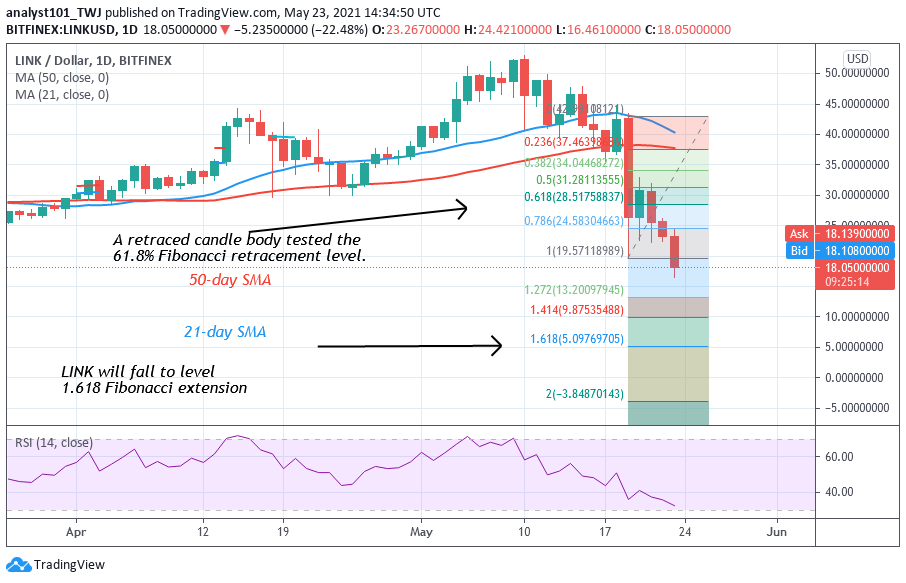
LINK price is falling as it broke the previous low at $19. This recent fall was a result of rejection from level $44. Firstly, LINK dropped to $19.69 and corrected upward. The upward correction was terminated at $32 as the market resumes downward. In the previous price action, LINK was repelled at the peak price of $52.50. The downtrend resumes as price makes a series of lower highs and lower lows. Meanwhile, on May 19 downward, a retraced candle body tested the 61.8% Fibonacci retracement level. The retracement indicates that LINK price will decline to level 1.618 Fibonacci level or level $5.09.
Chainlink (LINK) Indicator Analysis
LINK has fallen to level 32 of the Relative Strength Index period 14. It indicates that the market is approaching the oversold region. The 21-day SMA and the 50-day SMA are sloping horizontally indicating the previous sideways move.The altcoin is below 20% range of the daily stochastic. It indicates the crypto has fallen into the oversold region of the market. Buyers are expected to emerge at the oversold region.

Technical indicators:
Major Resistance Levels – $40.00, $42.00, $44.00
Major Support Levels – $26.00, $24.00, $22.00
What Is the Next Direction for Chainlink (LINK)?
LINK is falling because of the recent rejection at $32 high. On April 16 downtrend, a retraced candle tested the 61.8% Fibonacci retracement level. It indicates that LINK will fall to level 1.618 Fibonacci extension or at $4.78 low. From the price action, the market is falling and approaching the low of $5.

Note: new.cryptosignals.org is not a financial advisor. Do your research before investing your funds in any financial asset or presented product or event. We are not responsible for your investing result