Fetch.ai (FETUSD) Is Currently Seeing a Shift in Market Dynamics
Estimated Reading Time: 3 minutes
Don’t invest unless you’re prepared to lose all the money you invest. This is a high-risk investment and you are unlikely to be protected if something goes wrong. Take 2 minutes to learn more
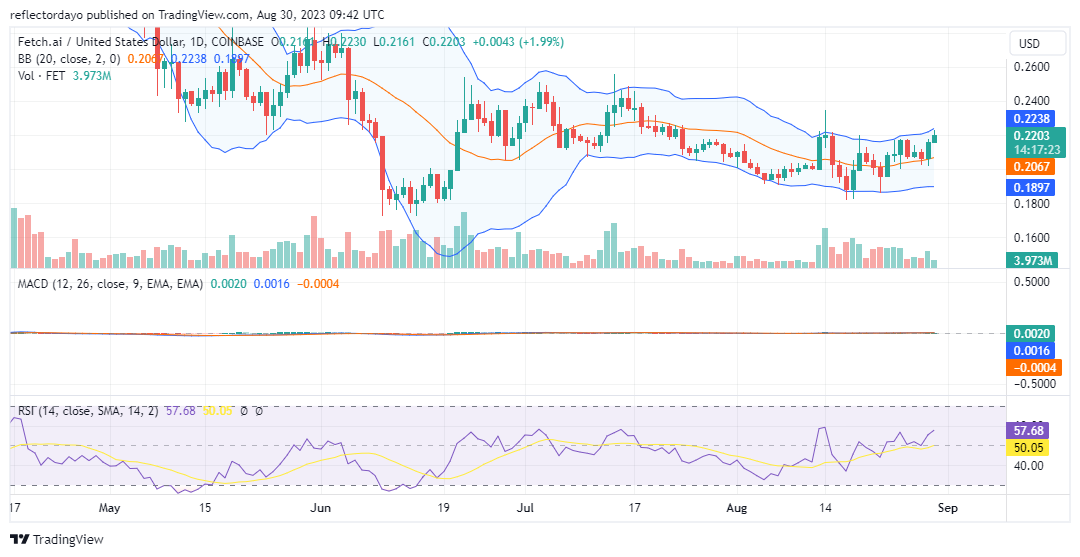
Starting from the price level of approximately $0.18, there is a noticeable display of strong bullish sentiment among Fetch.ai enthusiasts. Consequently, the market seems to be undergoing a shift in its trajectory. Notably, the $0.18 price level coincides with the support level from which the bullish cycle originated in mid-June. Although the bullish market that emerged in mid-June reached its peak around $0.26 on June 22, this level was subsequently retested by the bulls on two additional occasions: first on July 3, and then again in mid-July.
Following these events, the bear market gradually pushed the price downward. By August 13, liquidity had increased on both sides of the market, leading to heightened volatility. Despite this, the overall market direction remained uncertain. However, a more substantial support level formed at $0.195, sparking noticeable indications of upward movement in the market.
Fetch.ai Market Data
- FET/USD Price Now: $0.22
- FET/USD Market Cap: $180,378,161
- FET/USD Circulating Supply: 819,219,717 FET
- FET/USD Total Supply: 1,152,997,575 FET
- FET/USD CoinMarketCap Ranking: #138
Key Levels
- Resistance: $0.23, $0.24, and $0.26
- Support: $0.18, $0.17, and $0.16.
Price Prediction for Fetch.ai: The Indicators’ Point of View
The emergence of a hammer candlestick pattern in the vicinity of the $0.18 price level around both August 17 and 18 signals a potential bullish reversal. Another hammer candlestick took shape on August 22, this time at a slightly elevated support level of $0.195. This marked the juncture at which the Bollinger Bands commenced illustrating an altered price channel, coinciding with the formation of another hammer candlestick situated above the 20-day moving average. The Fetch.ai bullish momentum has also been influencing the upper standard deviation of the Bollinger Bands.
During this timeframe, the trading volume exhibits substantial histogram heights, substantiating the robust trading activities. This dynamic suggests a heightened likelihood of the price reaching the target. Nevertheless, for this positive scenario to materialize, buyers must effectively breach the $0.22 price level.
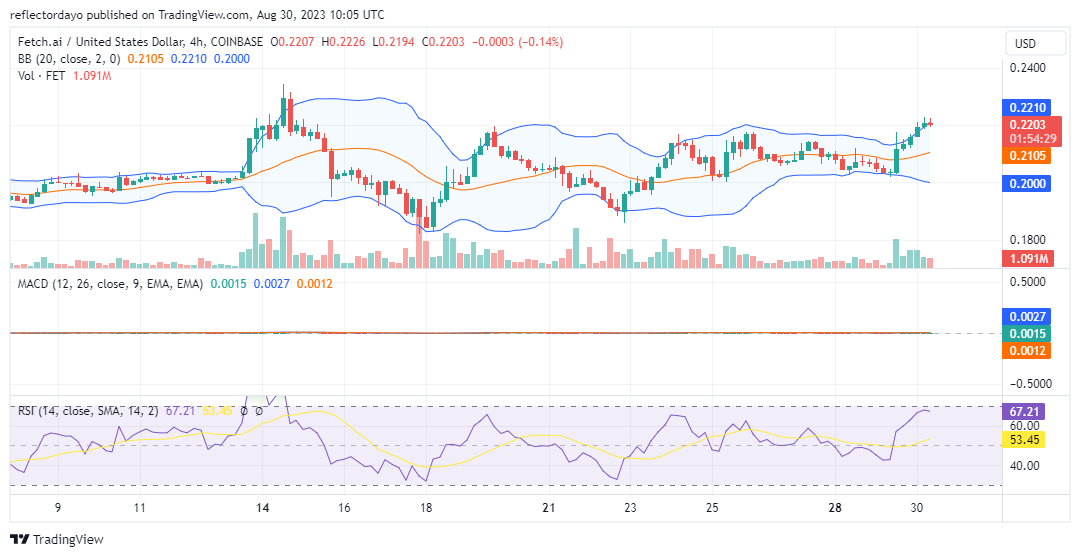
FET/USD 4-Hour Chart Outlook
Examining the market from a 4-hour perspective, our analysis using the Bollinger Bands indicator reveals an escalating volatility level as the market draws closer to the $0.200 milestone. Additionally, the Relative Strength Index (RSI) registers at 67, implying that the market could potentially accommodate further bullish momentum. To ensure the ongoing bullish trend, buyers must secure support above the $0.2 price level. This foundational support is pivotal for sustaining the continuity of the current bull market.