Chainlink (LINK) Fluctuates in a Tight Range, Faces Rejection at $21
Estimated Reading Time: 2 minutes
Don’t invest unless you’re prepared to lose all the money you invest. This is a high-risk investment and you are unlikely to be protected if something goes wrong. Take 2 minutes to learn more
Chainlink (LINK) Long-Term Analysis: Bearish
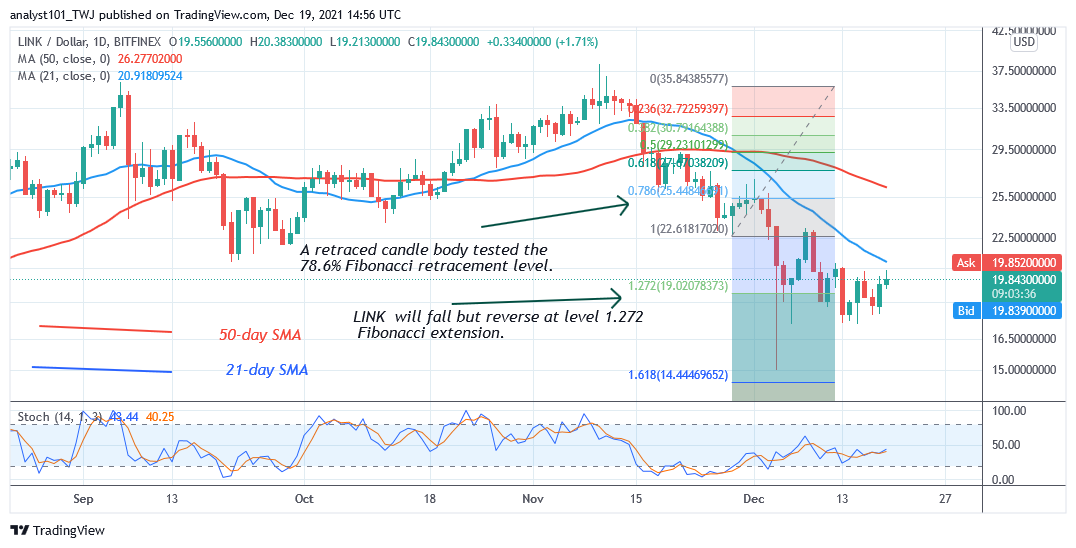
Chainlink’s (LINK) price is still in a downward correction as it faces rejection at $21. After the December 4 price slump, the cryptocurrency was fluctuating between $17.20 and $23. However, after the price correction and subsequent rejection on December 8, Chainlink upward move has been restricted below $21 high. The altcoin is now fluctuating between levels $17.20 and $21. There is the tendency for a price breakdown or breakout if the altcoin continues to trade in a tight range. On the upside, if price breaks above the resistance levels at $21 and 23, the altcoin will rally above $26. Otherwise, the downward correction will continue
Chainlink (LINK) Indicator Analysis
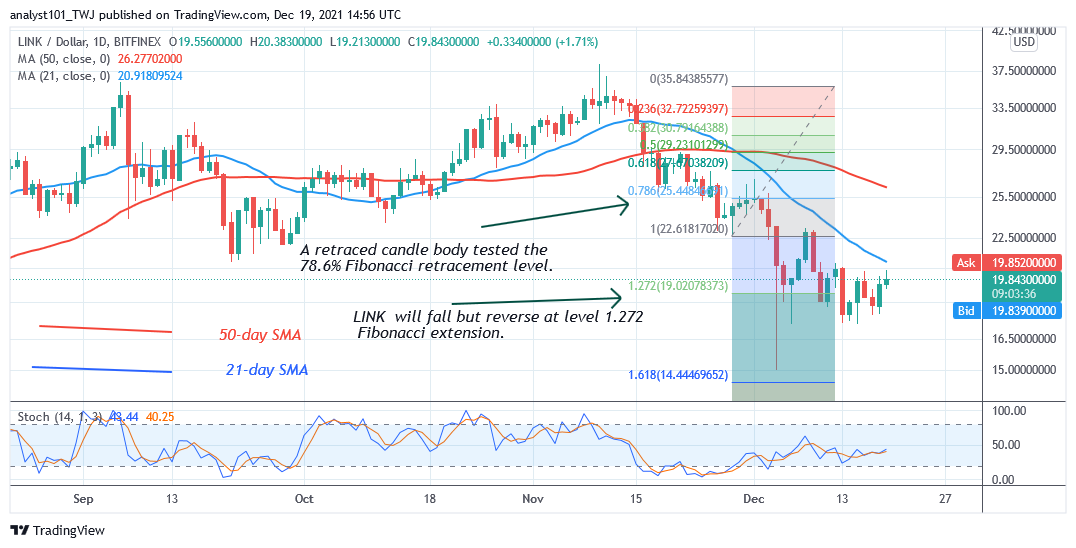
Chainlink is rising as it reaches level 42 of the Relative Strength Index for period 14. It indicates that the altcoin is still in the downtrend zone and capable of falling on the downside. The 21-day and the 50-day line moving averages are sloping southward indicating the downtrend. LINK is above the 40% range of the daily stochastic. The altcoin is in a bullish momentum. The uptrend is stalled at the $21 high.
Technical indicators:
Major Resistance Levels – $40.00, $42.00, $44.00
Major Support Levels – $26.00, $24.00, $22.00
What Is the Next Direction for Chainlink (LINK)?
On the 4-hour chart, LINK is in a downward move as it faces rejection at $21. Today, the uptrend is facing resistance at the $21 high. The upward move has been resisted since December 12. Meanwhile, on December 28 downtrend; a retraced candle body tested the 78.6% Fibonacci retracement level. The retracement indicates that LINK will rise to level 1.272 Fibonacci extensions or $19.02.
You can purchase crypto coins here. Buy Token
Note: Cryptosignals.org is not a financial advisor. Do your research before investing your funds in any financial asset or presented product or event. We are not responsible for your investing results