Chainlink (LINK) Makes Positive Moves, Targets the $27 High
Estimated Reading Time: 2 minutes
Don’t invest unless you’re prepared to lose all the money you invest. This is a high-risk investment and you are unlikely to be protected if something goes wrong. Take 2 minutes to learn more
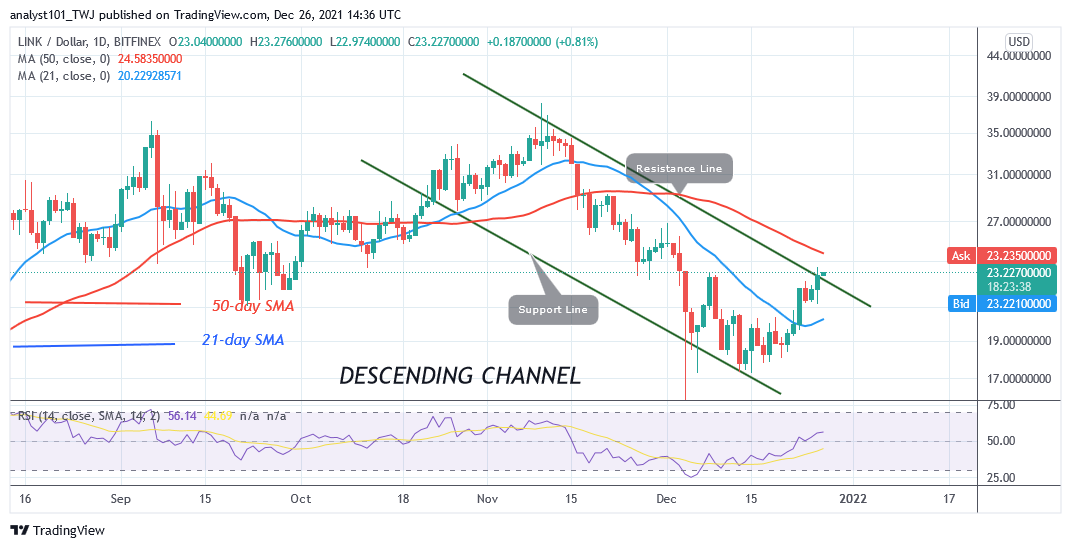
Chainlink (LINK) Long-Term Analysis: Bearish
Chainlink’s (LINK) price is making positive moves as it targets the $27 High . The altcoin breaks above the 21-day line moving averages. It is approaching the 50-day line moving average. If LINK’s price breaks above the 50-day line moving average, the market will rally to $35 high. The cryptocurrency will be out of downward correction. However, the market is approaching the overbought region. The current uptrend may have limitations to the upside. If the current uptrend faces rejection at the 50-day line moving average, the altcoin will fall and begin a range-bound move.
Chainlink (LINK) Indicator Analysis
Chainlink is rising as it reaches level 55 of the Relative Strength Index for period 14. It indicates that the altcoin is in an uptrend zone and capable of a further upward move. The price bars are above the 21-day line SMA but below the 50-day line moving averages indicating a possible range bound move. LINK is above the 80% range of the daily stochastic. It indicates that the market is trading in the overbought region. Sellers may emerge in the overbought region to push prices down.
Technical indicators:
Major Resistance Levels – $40.00, $42.00, $44.00
Major Support Levels – $26.00, $24.00, $22.00
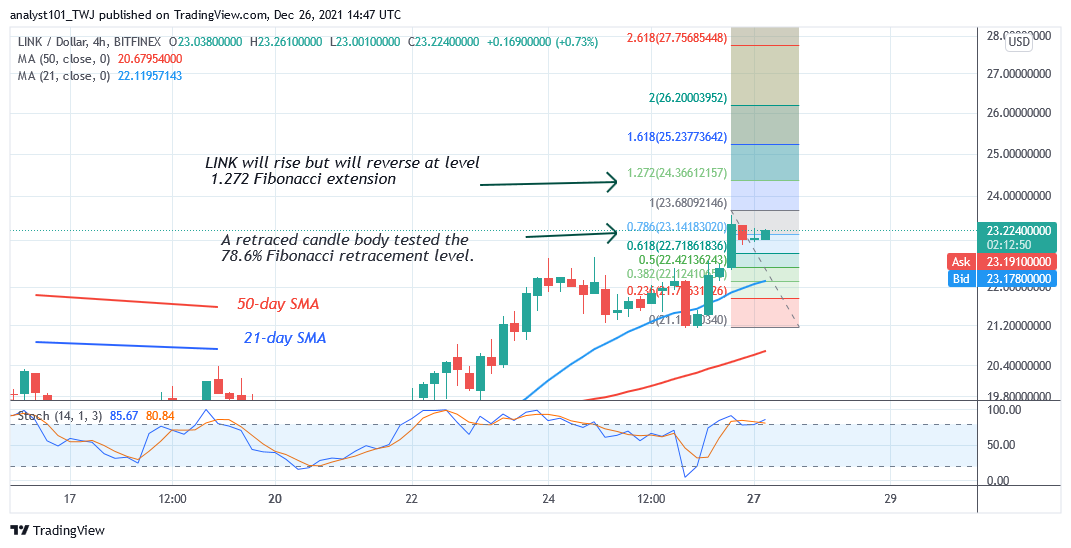
What Is the Next Direction for Chainlink (LINK)?
On the 4-hour chart, Chainlink is in an upward move as it targets the $27 High. LINK’s price is facing rejection at the $24 high as the market reaches the overbought region. Meanwhile, on December 26 uptrend; a retraced candle body tested the 78.6% Fibonacci retracement level. The retracement indicates that LINK will rise but reverse at level 1.272 Fibonacci extensions or $24.36.
You can purchase crypto coins here. Buy Token
Note: Cryptosignals.org is not a financial advisor. Do your research before investing your funds in any financial asset or presented product or event. We are not responsible for your investing results

