Chainlink (LINK/USDT) Secures a Renewed Bullish Interest
Estimated Reading Time: 3 minutes
Don’t invest unless you’re prepared to lose all the money you invest. This is a high-risk investment and you are unlikely to be protected if something goes wrong. Take 2 minutes to learn more

Chainlink Long-term Analysis: Ranging
Chainlink has recently shown signs of recovery amid general fluctuations in the cryptocurrency market. In the past few weeks, its price action has suggested a gradual shift from a bearish phase to a more optimistic bullish outlook.
Notably, LINK/USDT trades at $13.53, reflecting a 25.74% price surge above the previous session. This surge in the coin’s price is accompanied by 24.687 million traded volumes, suggesting a renewed interest from bullish traders.
However, traders must be cautious, as LINK seeks to break above the $13.75 level while maintaining crucial support at the $12.78 level.

Technical Indicators
Major Resistance Levels: $13.75, $14.00, and $16.00
Major Support levels: $12.78, $12.38, and $11.75
Chainlink Technical Analysis
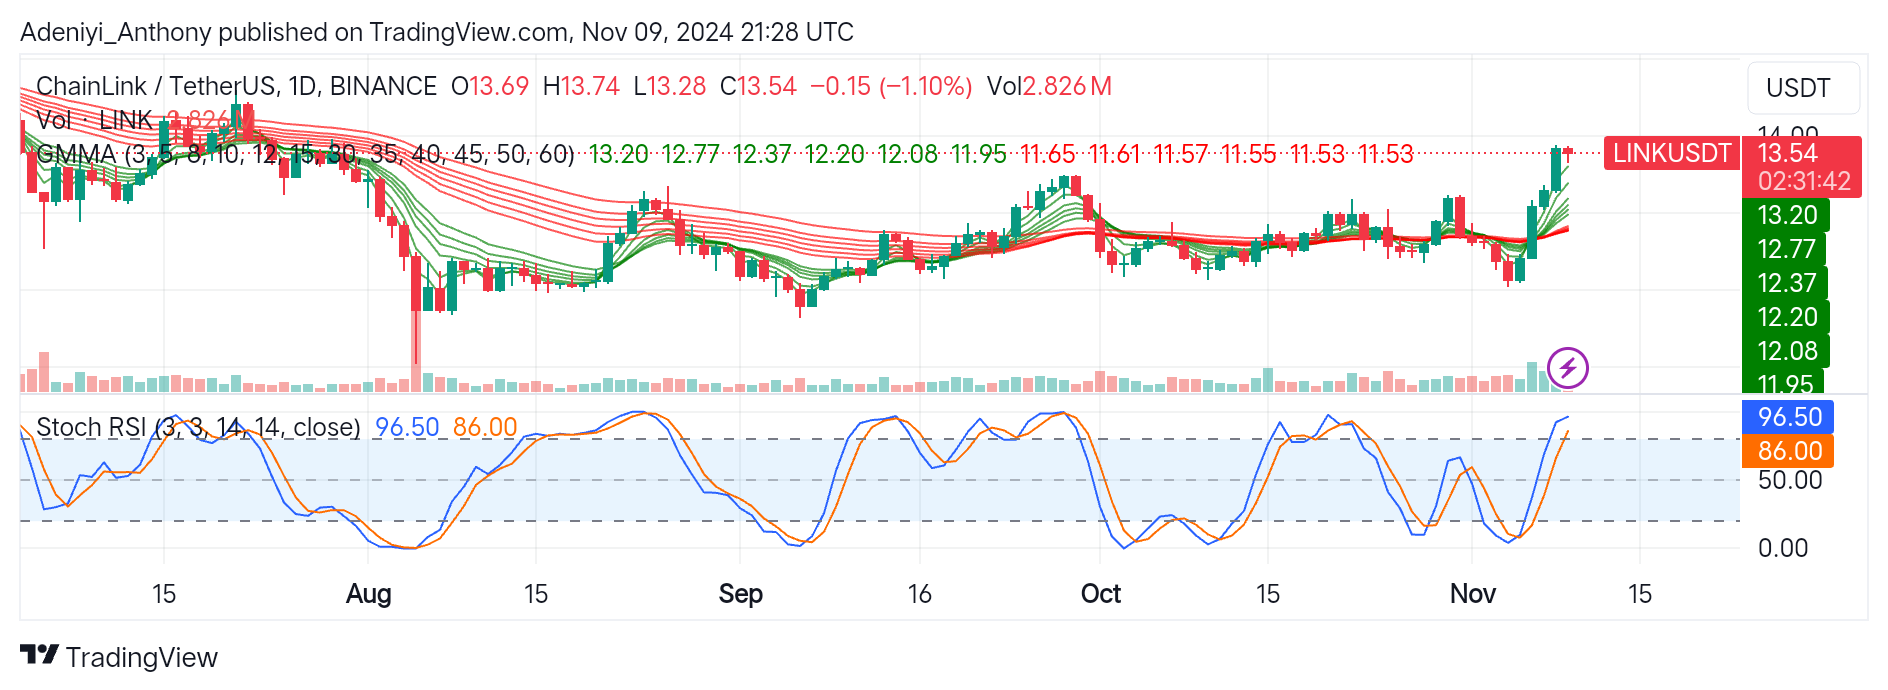
Technically, Chainlink against the Tether on the weekly timeframe operates in the overbought zone with price slightly above the Guppy Multiple Moving Averages (GMMA). The intending crossover of the set of exponential moving averages and the spike in trading volumes suggests a strengthened bullish trend if sustained.
From the bottom of the chart, the Stochastic RSI suggests a near-overbought condition. This is an indicator that a pause or a potential pullback might be on the horizon.
However, traders should monitor the $13.75 and $12.78 levels, as a breach above the latter would indicate a bullish trend towards the $16.00 level. Conversely, a break below the $12.78 would suggest a price dip towards the $12.37.
LINK/USDT Analysis: What to Expect
LINK/USDT on the daily timeframe has been bullish for days, while the current price action suggests a slight dip. However, despite the minor pullback in price, the surge in price over the last couple of days has placed the coin well above the GMMA. To this end, the immediate resistance at $13.75 must be cleared for further upside movement. Otherwise, a fall below the $12.77 level in this timeframe would indicate a fall to $12.37 and beyond.
On the other hand, the Stochastic RSI on this chart suggests an overbought condition, and the pair may experience a pause or a slight pullback before making the next upside move. However, traders should watch for the line crossover as an early sign of a potential pullback.
You can purchase crypto coins here. Buy LBlock