ChainLink (LINK/USDT) Consolidates Near a Critical Level
Estimated Reading Time: 3 minutes
Don’t invest unless you’re prepared to lose all the money you invest. This is a high-risk investment and you are unlikely to be protected if something goes wrong. Take 2 minutes to learn more

ChainLink Long-term Analysis: Ranging
As observed in the chart below, Chainlink against the Tether has been consolidating within a tight range, which is mostly dominated by sideways movement. This suggests that the market awaits a potential and decisive breakout in either direction.
Chainlink against the Tether in the middle of the year has been on a downtrend, with several failed attempts to hit past the $14 level. With the recent price actions around the mid-dynamic resistance level at $11.77, the pair seeks to break above this level. However, a break above $11.77 would indicate further bullish momentum towards the $14.55 level.
Currently, LINK/USDT operates at $10.75 near the mid-band, with a minor percentage of 2.18% negative change from the previous session. If the price fails to maintain this momentum and there is a spike in trading volume, the pair may have to retest the $10 psychological level.
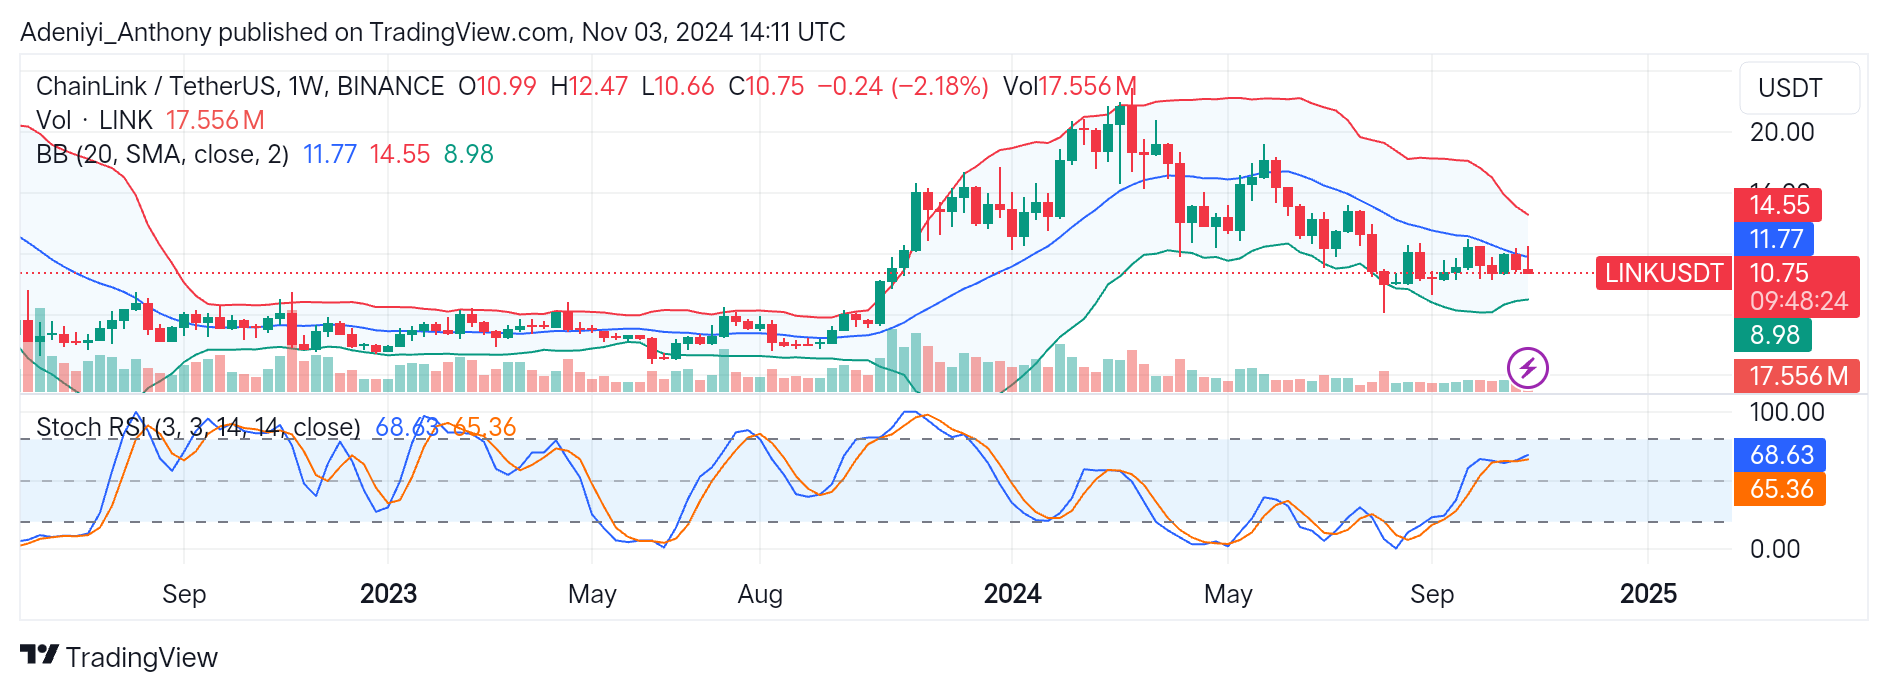
Technical Indicators
Major Resistance Levels: $14.55, $15.00, and $16.00
Major Support Levels: $10.00, $8.98, and $8.50
ChainLink Technical Analysis:
The analysis of Chainlink against the Tether shows a directionless market, with prices oscillating within a close range of $9 and $14 levels. However, the tightened Bollinger suggests an impending breakout is on the horizon.
At the bottom of the chart, the Stochastic RSI suggests caution as the price might experience a pullback or reversal unless there is a significant buying volume. Otherwise, a directional change of the lines and a spike in selling volume will cause the price to go south.
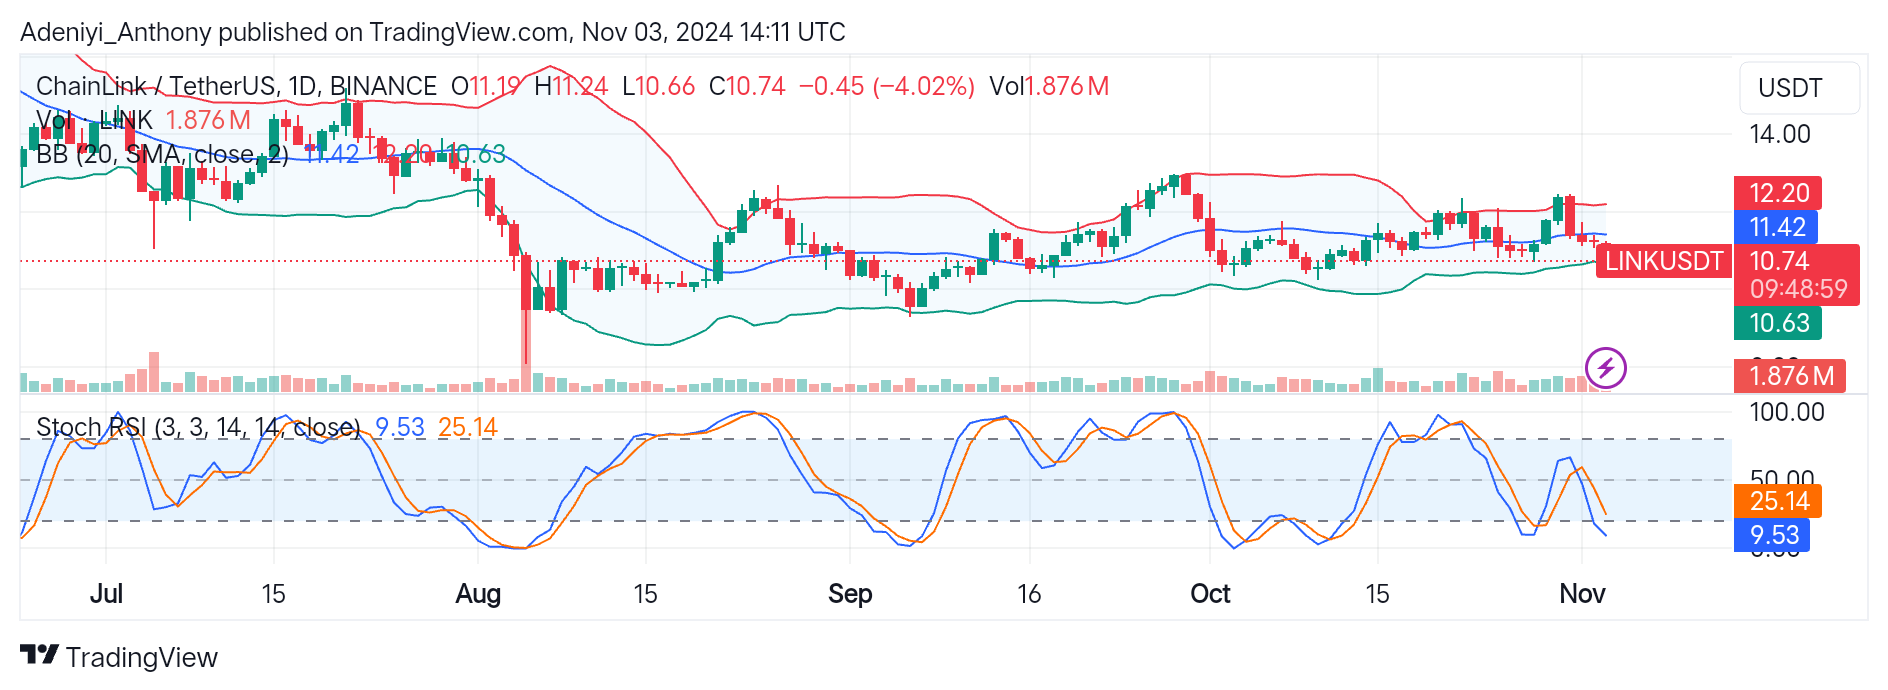
LINK/USDT: A Breakout to Which Direction?
The analysis of LINK/USDT on a daily chart presents a bearish setup, with the price falling from a previous high of $12.17 to $10.74. However, the tightened Bollinger band suggests the market is now oscillating within a close range, and a potential reversal is close provided trading buying volume increases. Alternatively, the pair may see a further downtrend if the selling pressure persists.
The Stochastic RSI suggests the pair operates in the oversold region, with potential upside reversal. To this end, traders must watch out for the Stochastic crossover alongside volume increase. Otherwise, a price dip with an increased selling volume will see the price test the band at $10.63.
You can purchase crypto coins here. Buy LBlock