Chainlink (LINK/USDT) Tests the $11.99 Level
Estimated Reading Time: 3 minutes
Don’t invest unless you’re prepared to lose all the money you invest. This is a high-risk investment and you are unlikely to be protected if something goes wrong. Take 2 minutes to learn more

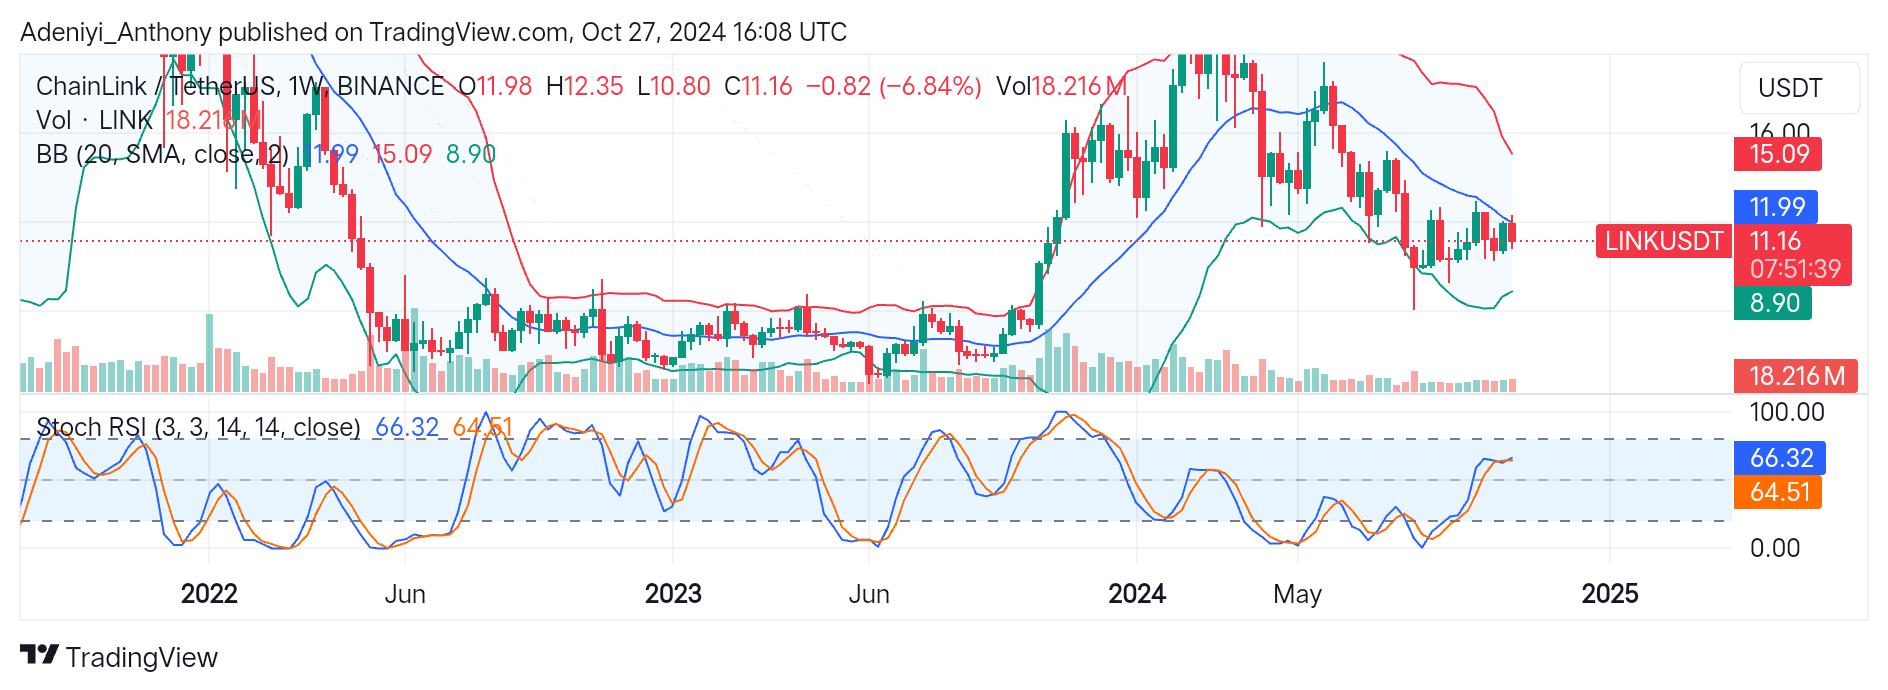
ChainLink Long-term Analysis: Bearish
With the formation of lower highs followed by short-term upside retracement, ChainLink against the Tether has experienced a fall in price for an extended period of the year.
The current price actions around the lower band suggest reduced volatility in the market, and there may be a potential breakout in the near term. However, with the low trading volume and a 6.84% drop in price, traders are rather indecisive in the market.
Recently, the price hovers near the 20-week simple average line, coupled with the low trading volume, suggesting a lack of bullish pressure in the market.
However, a break above $11.99 may signal the start of a new upside trend, but with the overbought condition of the Stochastic RSI, the pair may consolidate or see a downtrend once trading volume increases.
LINK/USDT currently trades around $11.16 with 18.261 million trading volume.
Technical Indicators
Major Resistance Levels: $11.99, $15.00, and $20.00
Major Support Levels: $8.90, $7.50, and $5.50
ChainLink Technical Analysis
Chainlink, since attaining its highest peak in 2021, has been on a downtrend and is currently operating between $15 and $8.90 levels. However, the current ranging phase suggests the market may be building up based on an indication of a potential uptrend if buying pressure increases.
The activities of the price at the lower segment of the Bollinger bands present the oversold condition of the pair. However, a break above the mid-band at $11.99 could signal an upside movement to the $15 level at the upper band.
On the downside, the Stochastic oscillator displays the pair in a near-overbought condition, and a shift into the zone may suggest a potential reversal above the immediate resistance level; otherwise, a dip below these levels could potentially lead to a retest of lower support levels.
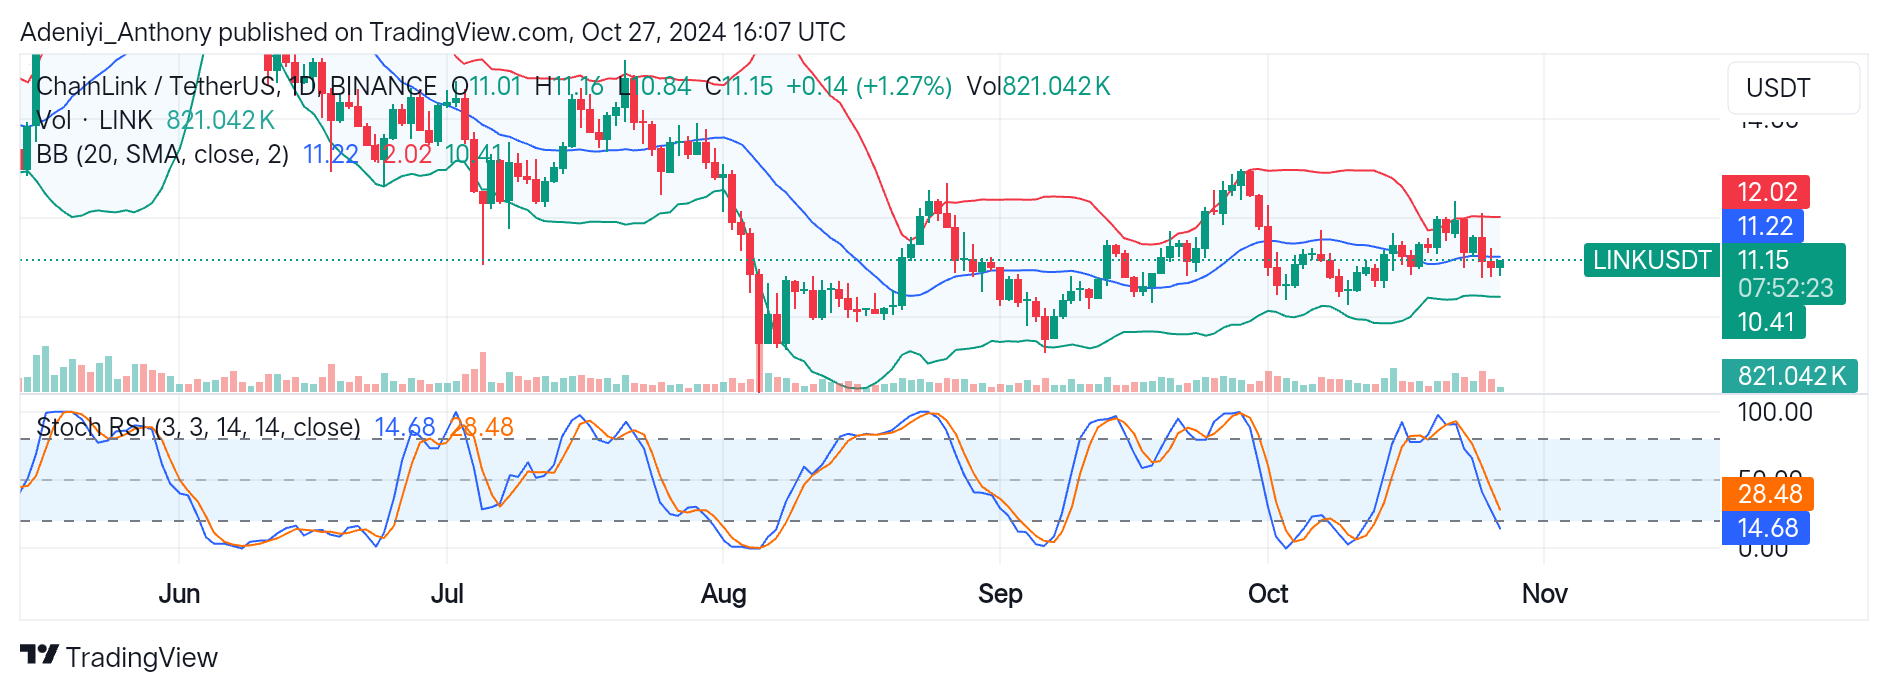
LINK/USDT Analysis: Where From Here?
LINK/USDT on a daily chart operates within tight bands, which suggest low volatility and an impending breakout. Moreover, with the current oversold condition in the market, there might be a potential short-term retracement soon. In this timeframe, LINK/USDT trades at $11.15, with a slight positive difference from previous trades. However, the lower and middle bands are key areas in which traders needs to check for potential price movement.
The indicators in this timeframe suggest an oversold condition for the pair, but the key levels to watch are the $11.22 and $10.41 levels. A close above the former may suggest a trend reversal towards $12.02. while a close below the $10.41 may signal further downside.
You can purchase crypto coins here. Buy LBlock