Chainlink Meanders Sideways as It Hovers Above $10
Estimated Reading Time: 2 minutes
Don’t invest unless you’re prepared to lose all the money you invest. This is a high-risk investment and you are unlikely to be protected if something goes wrong. Take 2 minutes to learn more

Chainlink (LINK) Long-Term Analysis: Ranging
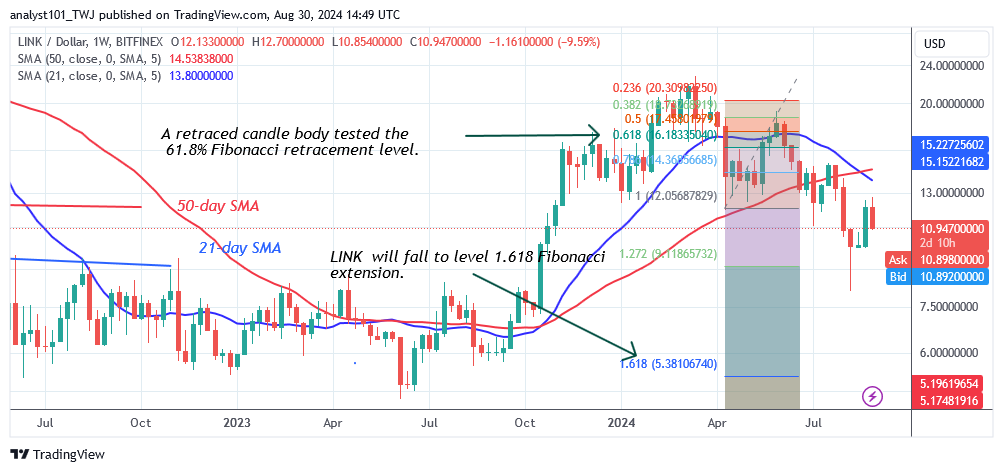
Chainlink’s (LINK) price has continued its sideways move as it hovers above $10. Furthermore, the bulls have stopped the altcoin’s decline above $9.00, allowing it to resume its upward trend. For the past three weeks, the cryptocurrency has traded above the $9.00 support but below the $12.00 barrier. Despite recovering from a low of $8.08, the price indication predicts a probable drop.
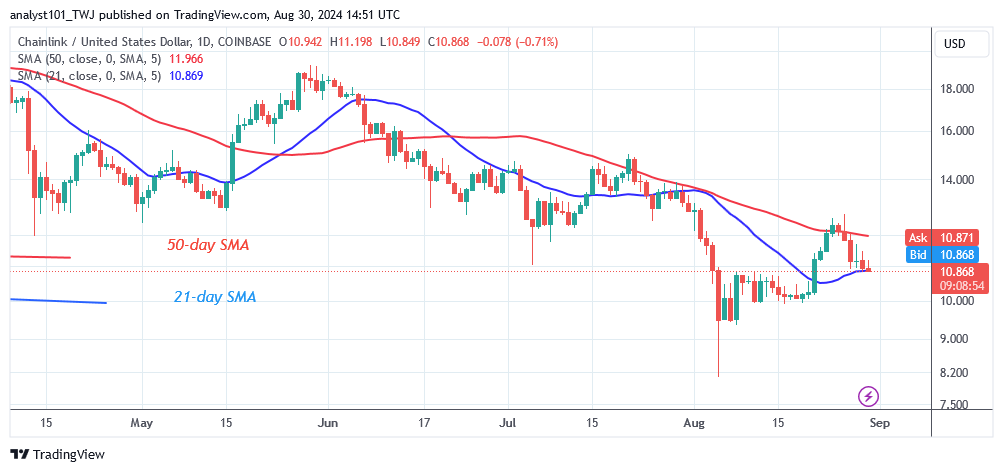
Chainlink is currently sliding after breaking below the moving average lines. On the downside, if the altcoin retraces and falls below the previous low of $8.08, it will fall to a low of $5.38. The altcoin is dropping, reaching a low of $10.63 at the time of writing.
Technical indicators:
Major Resistance Levels – $20.00, $22.00, $24.00
Major Support Levels – $12.00, $10.00, $8.00
Chainlink (LINK) Indicator Analysis
The price bars have returned to below the moving average lines after being caught between them. The cryptocurrency will fall as it trades in the bearish trend zone. The weekly chart shows a bearish crossover, indicating that the LINK price will fall further to the downside.
What Is the Next Direction for Chainlink (LINK)?
Chainlink is declining as it hovers above $10. The rejection has forced the altcoin to revisit its prior low of $8.08. The sideways movement may continue if the altcoin retraces and remains above the current support level of $9.00. However, if the current support level is broken, the bearish momentum could continue. The crypto signal is unfavorable as altcoins continue selling pressure.
You can purchase Lucky Block here. Buy LBLOCK
Note: Cryptosignals.org is not a financial advisor. Do your Research before investing your funds in any financial asset or presented product or event. We are not responsible for your investing result.