Chainlink Slumps to the Range-Bound Zone, Battles Resistance at $19
Estimated Reading Time: 2 minutes
Don’t invest unless you’re prepared to lose all the money you invest. This is a high-risk investment and you are unlikely to be protected if something goes wrong. Take 2 minutes to learn more

Free Crypto Signals Channel
Chainlink (LINK) Long-Term Analysis: Bearish
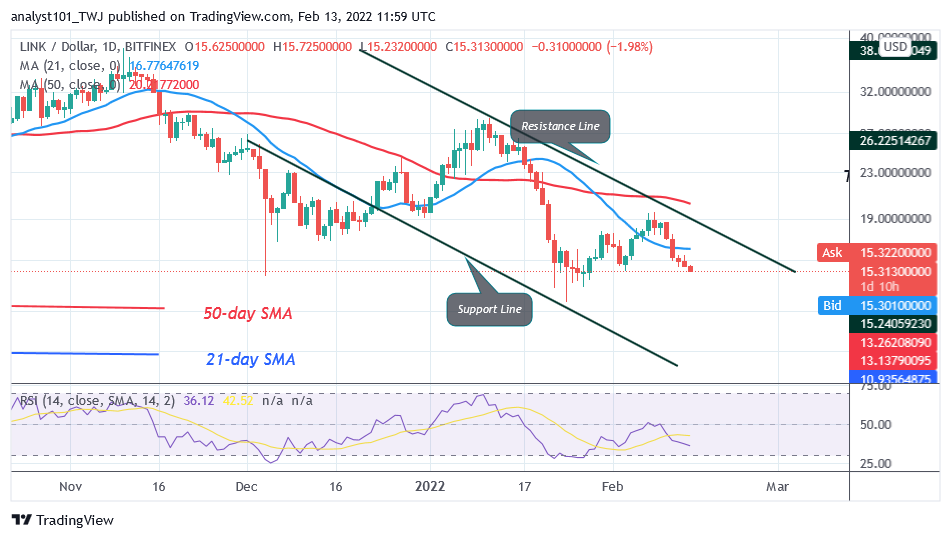
Chainlink’s (LINK) price has resumed downward correction as it battles resistance at $19. The previous bullish momentum broke above the 21-day line moving average but was hindered at the $19 resistance. Consequently, the market declined to the previous low as the altcoin resumed a downward correction. The altcoin is falling and approaching the previous low of $14. On the upside, if the crypto’s price rebounds above the current support, the uptrend will resume.
Chainlink (LINK) Indicator Analysis
Chainlink is at level 36 of the Relative Strength Index Period 14. The altcoin is approaching the oversold region of the market. The selling pressure is likely to subside as buyers emerge in the oversold region. Chainlink is below the 20% range of the daily stochastic. The altcoin has reached the oversold region of the market. The crypto’s price is below the 21-day SMA and the 50-day SMA indicating the downtrend.
Technical indicators:
Major Resistance Levels – $40.00, $42.00, $44.00
Major Support Levels – $26.00, $24.00, $22.00
What Is the Next Direction for Chainlink (LINK)?
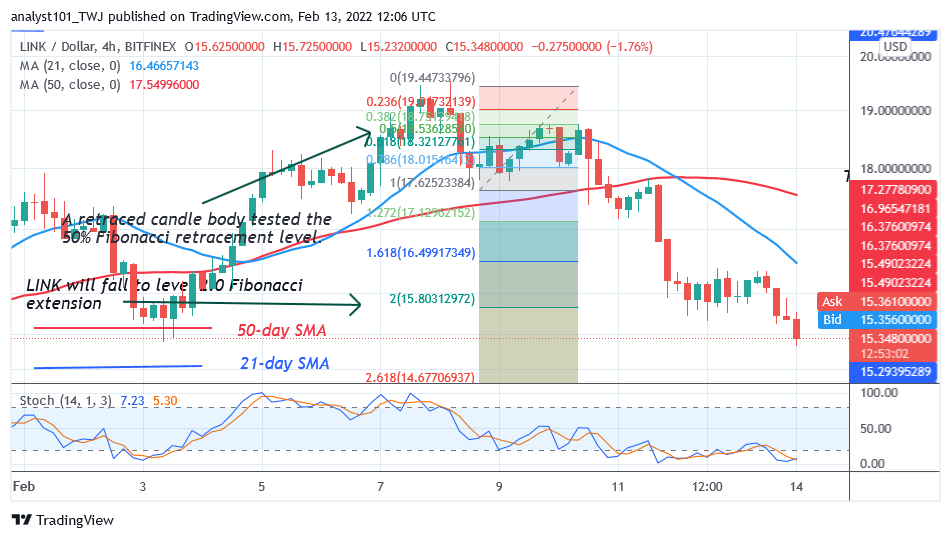
Chainlink has declined because of the recent rejection as it battles resistance at $19. Meanwhile, on February 8 downtrend; a retraced candle body tested the 50 % Fibonacci retracement level. The retracement suggests that LINK will fall to level 2.0 Fibonacci extension or $15.8. From the price action, the altcoin is retesting the 2.0 Fibonacci retracement level.
You can purchase crypto coins here. Buy Token
Note: Cryptosignals.org is not a financial advisor. Do your research before investing your funds in any financial asset or presented product or event. We are not responsible for your investing results