$0.6800 Resistance Keeps 0x (ZRXUSD) At Bay
Estimated Reading Time: 3 minutes
Don’t invest unless you’re prepared to lose all the money you invest. This is a high-risk investment and you are unlikely to be protected if something goes wrong. Take 2 minutes to learn more
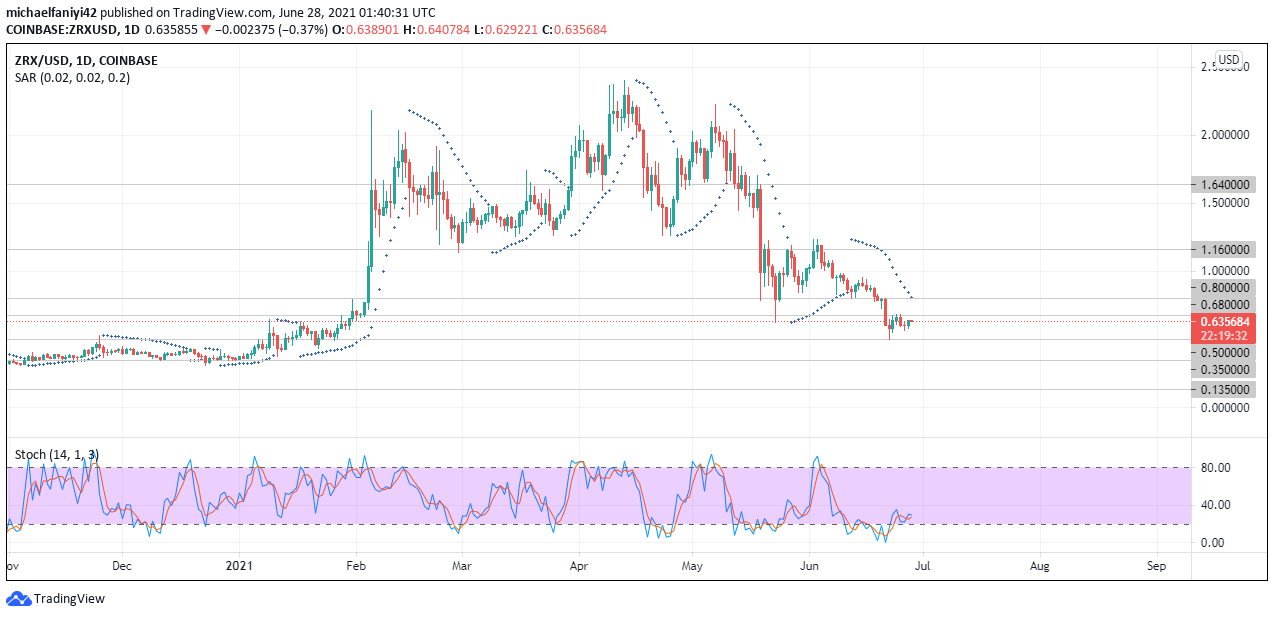
ZRXUSD Market Analysis – 0x Upward Movement Has Been Blocked by the $0.6800 Resistance
0x $0.6800 resistance has blocked the market from making a bullish move. Ever since the fall in prices on the 19th of May 2021 from the $1.6400 key level to the $0.8000 key level, the market has generally been under bearish pressure.
There was a brief consolidation of 0x for 29 trading days between the 20th of May and the 19th of June. The consolidation phase was between $1.6000 resistance and $0.8000 support. The buyers tried several times to lift the market, but then the $1.6000 support knocked it back every time. After a while, the sellers then dragged the coin below the consolidation support level.
The price, therefore, fell from the $0.8000 support and bypassed the $0.6800 support to reach the $0.5000 demand zone on the 22nd of June 2021. ZRXUSD was immediately pushed upwards by the bulls but met solid resistance at $0.6800. The price is currently trading below the key level of $0.6800.
The Parabolic SAR (Stop and Reverse) shows the current market trend as bearish. However, a change to the upside will see the indicator display a dot under the candlesticks, and that can only come if the price breaks through the $0.6800 resistance. The Stochastic oscillator gives cause for optimism that 0x will indeed break the $0.6800 barrier as its signal lines are currently lurking above the oversold region, ready for an upwards movement.
0x Significant Zones
Resistance Zones: $1.1600, $0.8000, $0.6800
Support Zones: $0.5000, $0.3500, $0.1350
Will 0x Break the $0.6800 Resistance?
The 4-hour chart shows that ZRX has been knocked down a couple of times by the $0.6800 resistance. The market has found strong support at $0.5850, which is mid-way between the $0.6800 resistance and the $0.5000 support. 0x has bounced up from $0.5850 and is approaching $0.6800 again.
On the 4-hour chart, the Parabolic SAR has displayed two dots below the candlesticks, indicating that the market has entered a bullish trend. The Stochastic oscillator also indicates bullishness. Its blue signal line is already in the overbought region, while its red signal line is still below it.
The market is expected to retest and eventually break through the $0.6800 resistance level.
You can purchase crypto coins here. Buy Tokens
Note: Cryptosignal.org is not a financial advisor. Do your research before investing your funds in any financial asset or presented product or event. We are not responsible for your investing results.