0x (ZRXUSD) Bears Turn on the Pressure at the Demand Level
Estimated Reading Time: 2 minutes
Don’t invest unless you’re prepared to lose all the money you invest. This is a high-risk investment and you are unlikely to be protected if something goes wrong. Take 2 minutes to learn more

Free Crypto Signals Channel
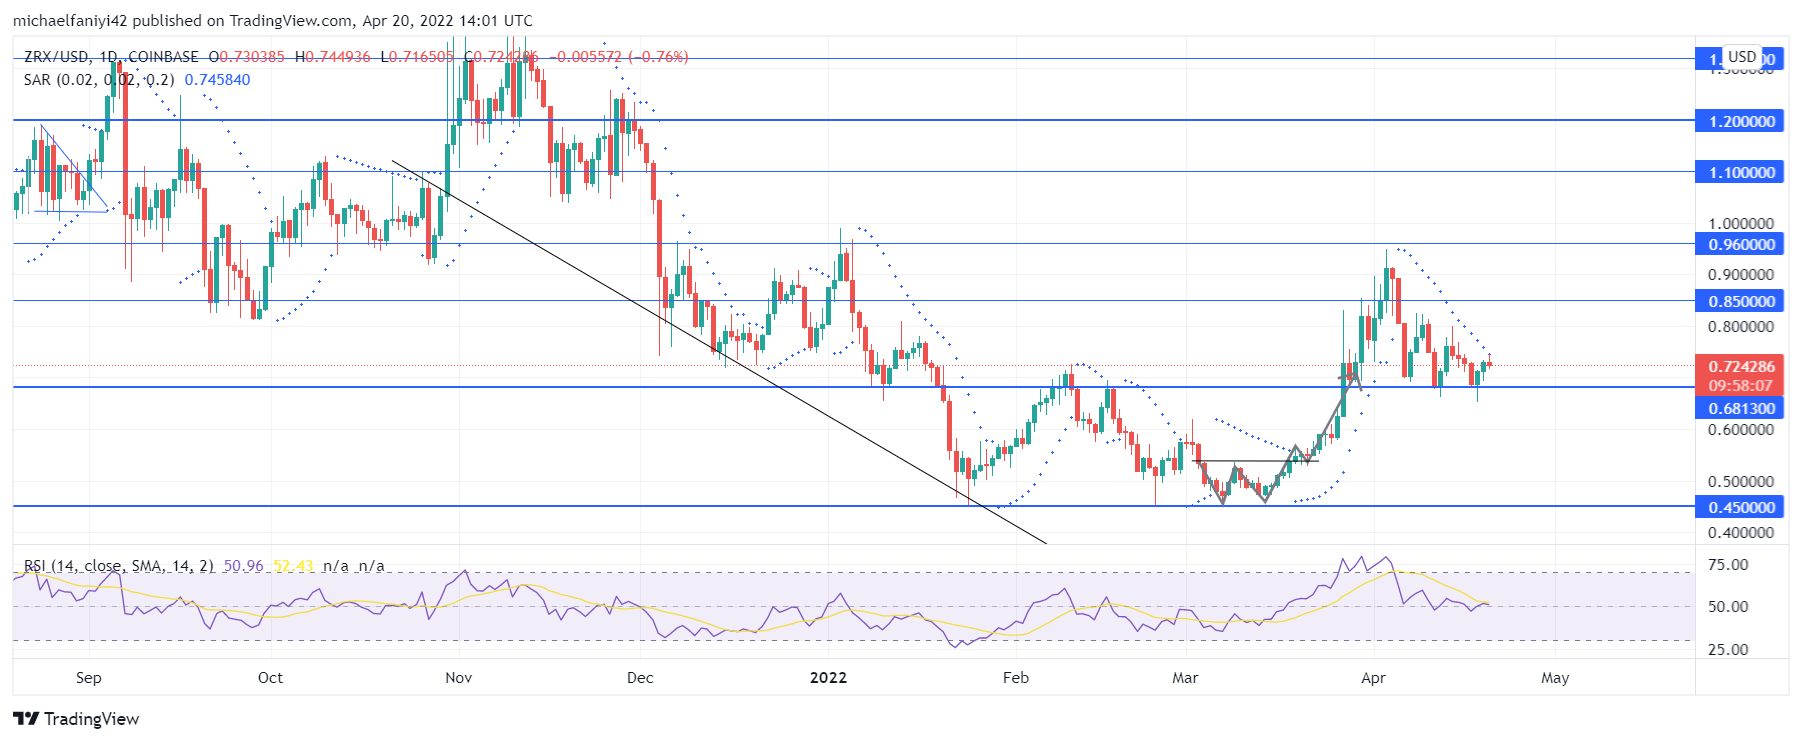
ZRXUSD Analysis – Bears turn on the pressure at the 0.68130 demand level
ZRXUSD bears turn on the pressure at the 0.68130 demand level. The market earlier rose to break the 0.68130 level on the 27th of March 2022. After that, the price rose further, defying the 0.85000 to reach 0.96000, where the market was rejected. The rejection led to a dip to 0.68130 as support. The bears began putting pressure on the market from here, and the price has failed to rise by about 0.85000 since then.
ZRXUSD Important Levels
Supply Levels: 0.85000, 0.96000
Demand Levels: 0.45000, 0.68130
The bears have been the masters of the market, but not until the price descended to the 0.45000 demand level. The buy-traders had set themselves in array at this level and immediately engaged in combat to take out the sellers’ rulership. This led to consolidation, with 0.68130 acting as the upper barrier. After about six weeks of sideways movement, the price formed a double bottom formation to break the 0.68130 supply level.
This led to a break out towards 0.96000. However, the buyers could not continue their momentum past this level as the price dropped back to 0.68130. Sellers are slowly stepping in to influence the market again as the price fails to rise above 0.85000. Hence, the price can be seen trading closer to the demand level. The Parabolic SAR (Stop and Reverse) dots remain stationed above the daily candles.
Market Expectations
On the daily chart, the RSI (Relative Strength Index) line has dropped to the mid-level and is undulating about that level. But the undulation on the 4-hour chart is from the oversold border to the mid-level, showing that bears are currently overpowering. The pressure on the demand level might lead to a drop back to the bulls’ rallying point at 0.45000.
How To Buy Lucky Block
Note: Cryptosignals.org is not a financial advisor. Do your research before investing your funds in any financial asset or presented product or event. We are not responsible for your investing results.