Quant Price Prediction: QNT/USD Faces Fresh Support Below $105
Estimated Reading Time: 3 minutes
Don’t invest unless you’re prepared to lose all the money you invest. This is a high-risk investment and you are unlikely to be protected if something goes wrong. Take 2 minutes to learn more
The Quant price prediction shows QNT sliding towards the downside as the cryptocurrency could create another low at $100.
Quant Price Prediction – January 23
QNT/USD Long-term Trend: Ranging (Daily Chart)
Key levels:
Resistance Levels: $130, $135, $140
Support Levels: $80, $75, $70
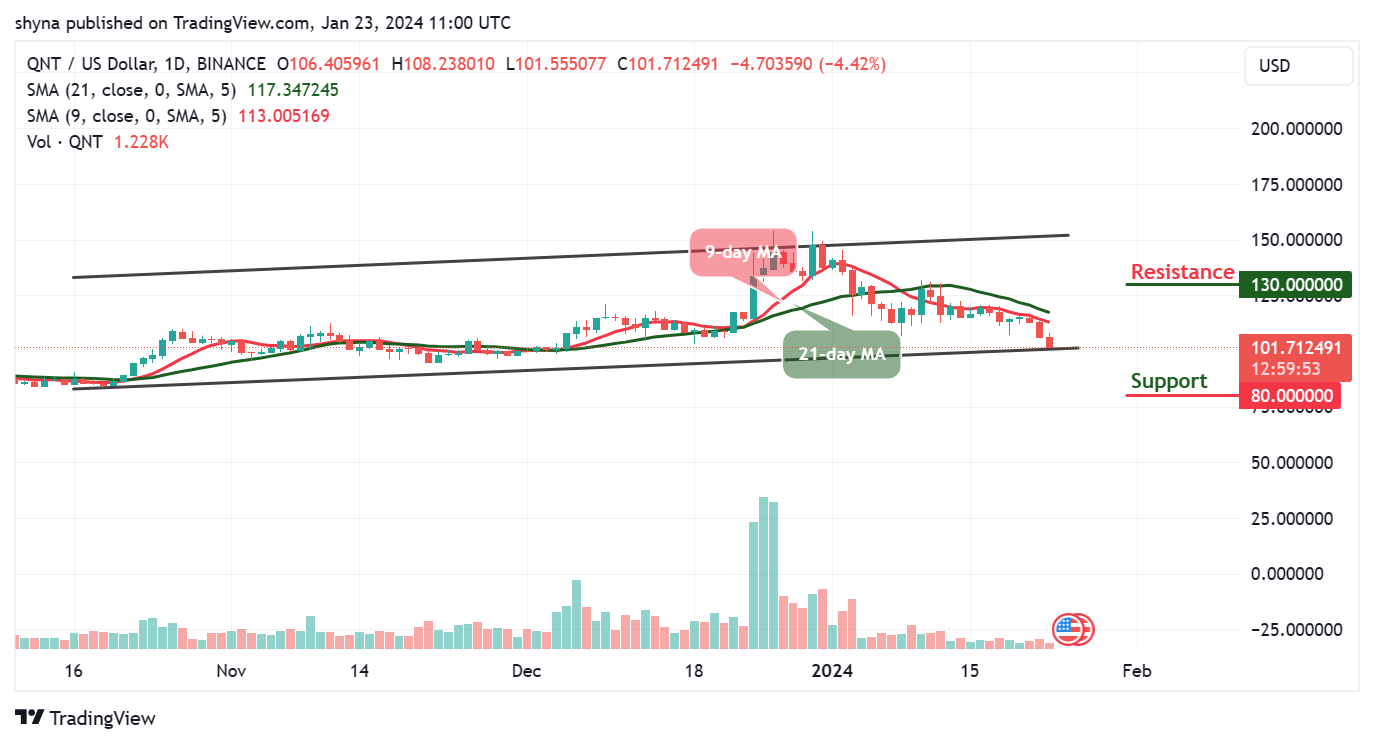
QNT/USD is dropping with another loss of 4.42% today as the crypto moves to cross below the lower boundary of the channel to reach the nearest support at $95. However, the daily chart reveals that this is a very important level as it is expected to provide strong support for the coin.
Quant Price Prediction: Quant Price May Cross Below $100
The Quant price begins to slide below the 9-day and 21-day moving averages at support provided by the trend line. A breakdown to the downside could cause the Quant price to create a new low below the $100 level. The coin is currently in a critical position with the next few days dictating the direction that it will head. A drop below the lower boundary of the channel could be detrimental to Quant as it could lead the coin back to the previous supports at $80, $75, and $70.
Meanwhile, if the buyers can rebound from the current level of $101.7, the first level of resistance could lie at $110. Above this, further resistance is expected at $120. This may likely be followed by the potential resistance levels at $130, $135, and $140. Presently, the 9-day MA is below the 21-day MA, suggesting that the coin may face a downward trend.
QNT/USD Medium-term Trend: Bearish (4H Chart)
According to the 4-hour chart, the Quant price is seen hovering at $102.1 as the coin hovers below the 9-day and 21-day moving averages. However, if the bulls push the market price toward the upper boundary of the channel, the coin may likely hit the resistance at $115 and above.
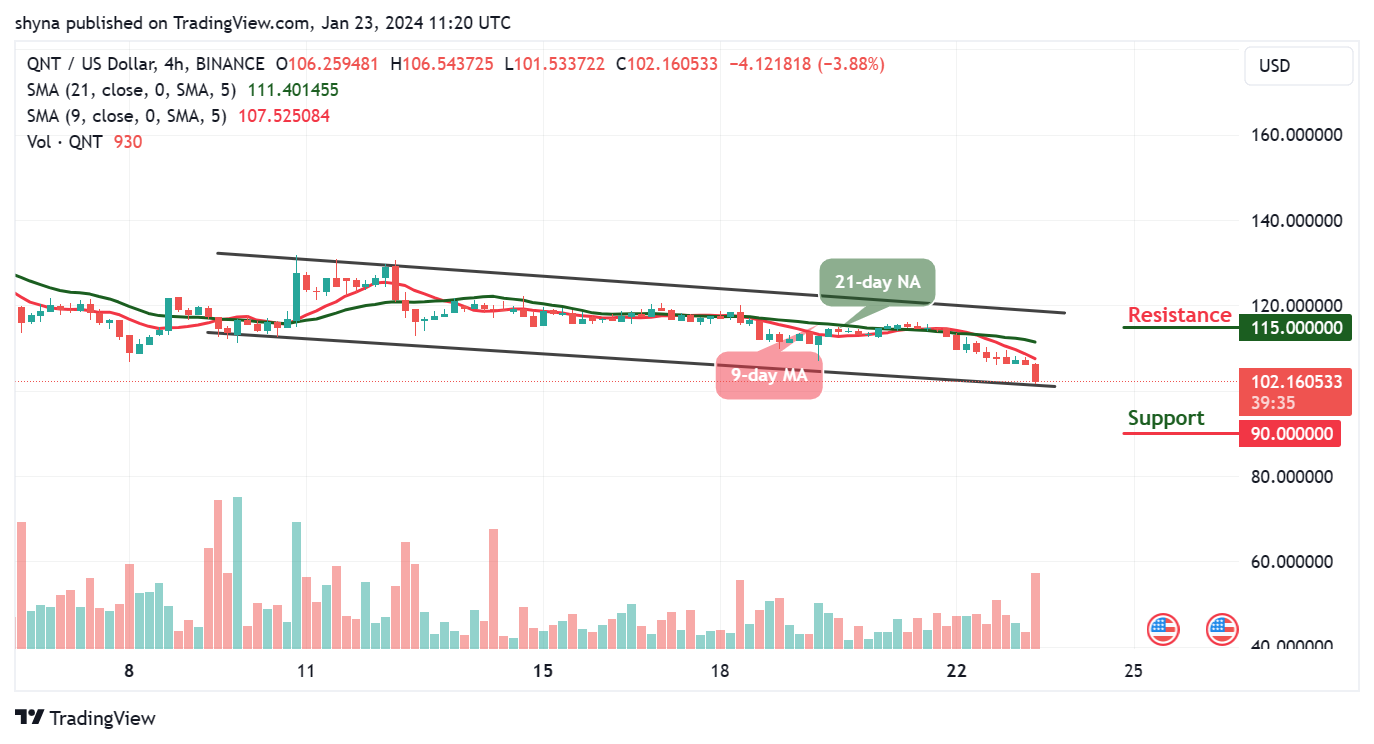
Nevertheless, it now appears that the cryptocurrency is at risk of seeing further downside as the multiple attempts to shatter its $101 support seem to indicate that bears are building momentum. As the 9-day moving average stays below the 21-day moving average, this could prepare for more downside as the coin may locate critical support at $90 and below.
Place winning Quant trades with us. Get QNT here