0x (ZRXUSD) Is Pushing Against a Critical Support Level
Estimated Reading Time: 2 minutes
Don’t invest unless you’re prepared to lose all the money you invest. This is a high-risk investment and you are unlikely to be protected if something goes wrong. Take 2 minutes to learn more

Free Crypto Signals Channel
0x Analysis – ZRXUSD Is Pushing Against the $0.450 Critical Level
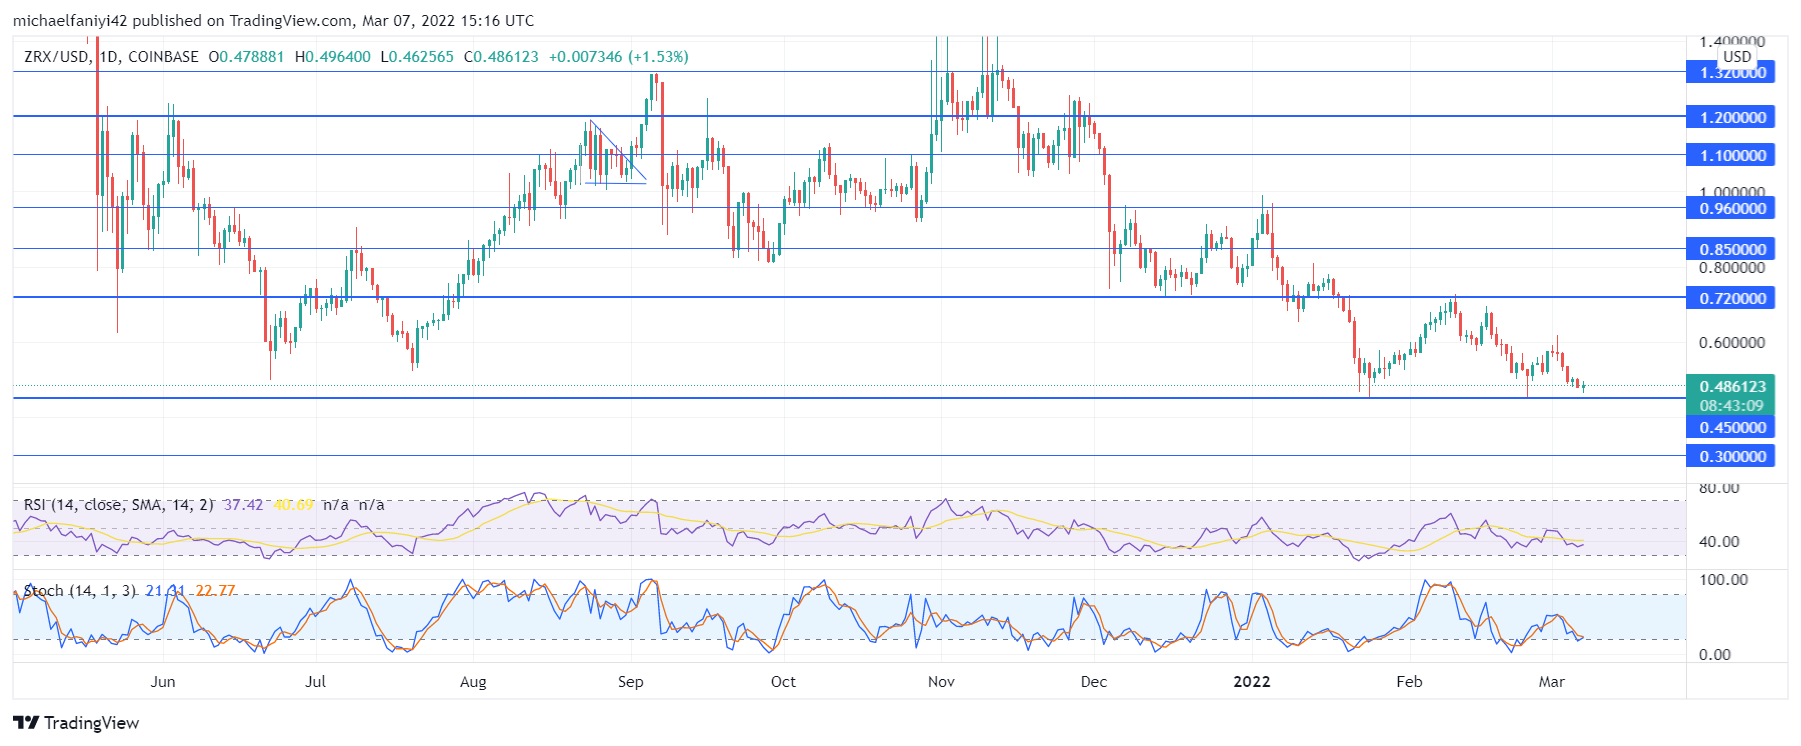
0x is pushing against the critical level at $0.450 as bears continue to have predominance over the coin. Market forces have been swaying the price up and down ever since it dropped to this demand level of $0.450 in late January. After testing the supply line at $0.720 once on the 9th of February, the coin has failed to attain that height and has instead been repeatedly pushing against the $0.450 demand level.
0x Critical Levels
Supply Levels: $0.960, $0.720,
Demand Levels: $0.450, $0.300
The bearish operation at the $0.450 demand zone is similar to what happened above the $0.720 critical level. The Bears have generally had the upper hand in the market, and they are using it to full effect to bypass the critical level. The price also dropped to $0.720 on the 4th of December and kept pushing hard against the critical level. This spanned a month into the new year till the level gave way.
Afterwards, the price dipped to the current demand level of $0.450. And the same tactics are being repeated all over again. This is certain to lead to another drop unless the market buyers react and oppose the market’s direction. The RSI (Relative Strength Index) line is plunging towards the oversold region to show current bearish activity. The Stochastic is at the edge of the oversold region.

Market Expectations
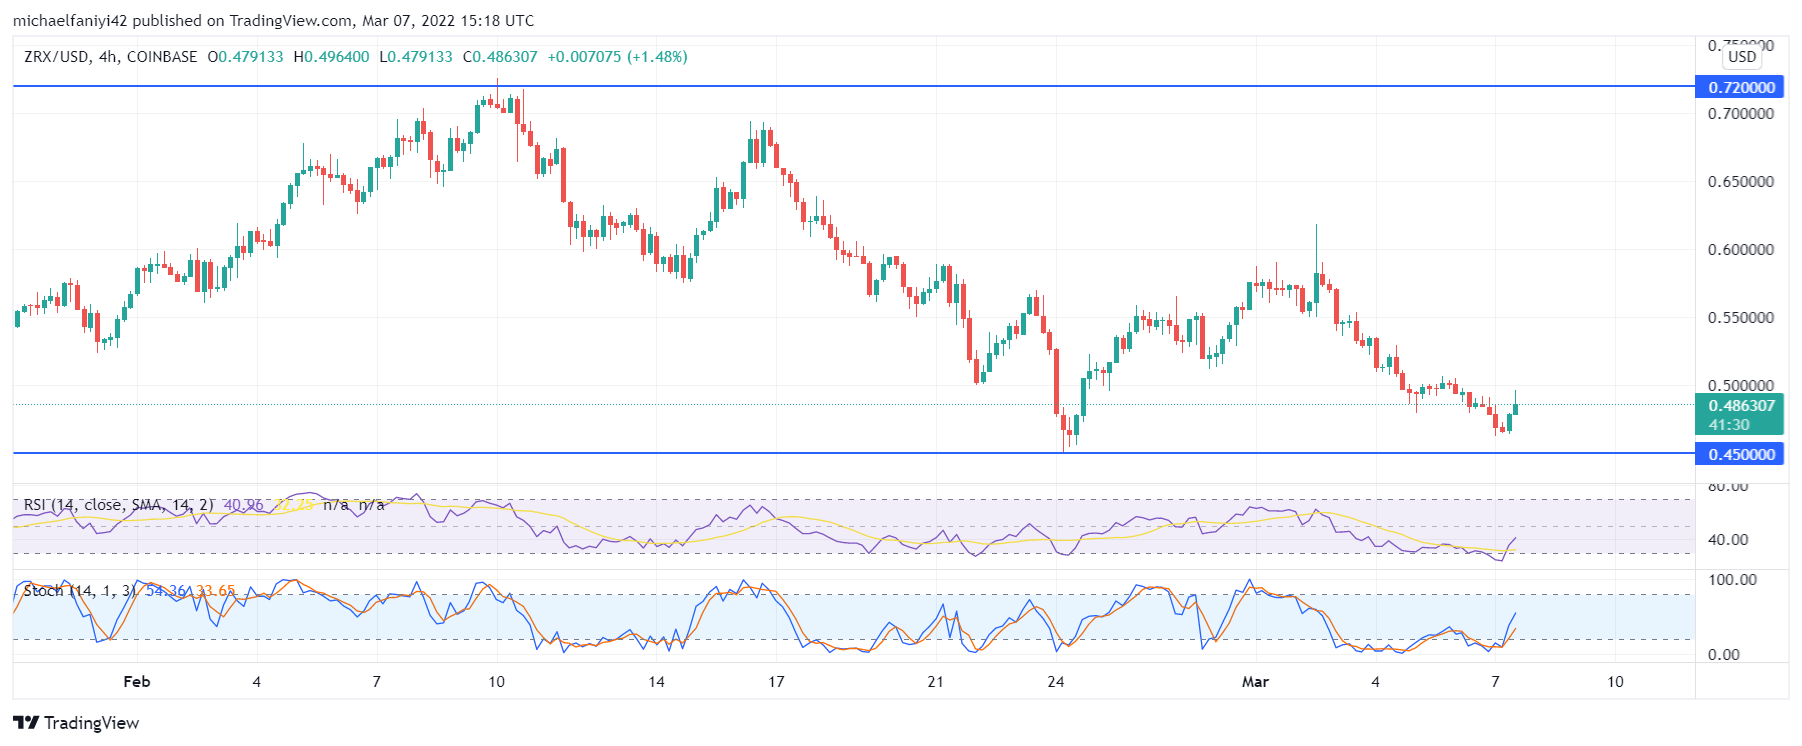
On the 4-hour chart, the price has dropped to the demand level, and both the Stochastic and the RSI indicators are well into the oversold region. A pullback is at least expected, but then it could either finally lead to the much-anticipated drop, or bulls could take advantage of it to lift the market. As it stands, the bears will likely push the coin to $0.300.
How To Buy Lucky Block
Note: Cryptosignals.org is not a financial advisor. Do your research before investing your funds in any financial asset or presented product or event. We are not responsible for your investing results.