0x (ZRXUSD) Retests Important Resistance Level
Estimated Reading Time: 3 minutes
Don’t invest unless you’re prepared to lose all the money you invest. This is a high-risk investment and you are unlikely to be protected if something goes wrong. Take 2 minutes to learn more
ZRXUSD Could Potentially Sell-off as It Retests an Important Resistance Level
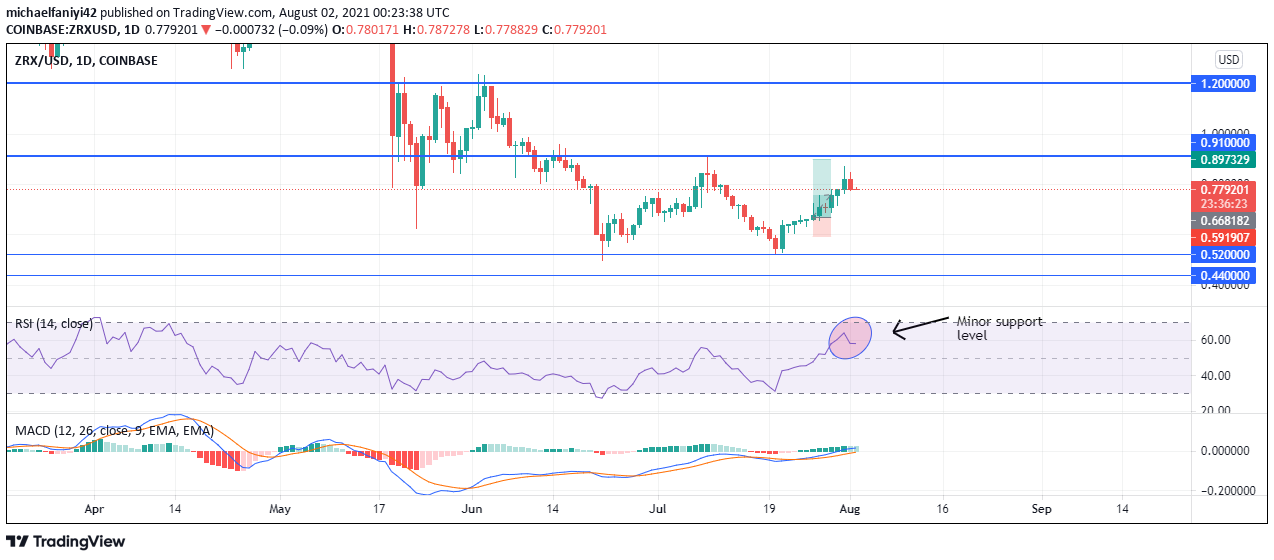
We could see a renewed downward trend as ZRXUSD retests an important resistance level. The 0.1900 price point has held as a very solid resistance level from which price has sold off massively twice. The first occurred during the 15th June decline. When price rallied to the level again on the 9th of July, 0.1900 held as a solid resistance point to push price downward. Price, though, failed to make a new lower low at 0.5200
Key Levels
Resistance Levels: 0.1900, 1.200
Support Levels: 0.5200, 0.4400
Plotting the RSI (Relative Strength Index) indicator on the daily chart, we can see price approaching the overbought area. This is indicative that sellers can come at any moment from now to drive price downwards. It could be to take out the downward objective at 0.5200 to create a new lower low. Alternatively, we could see the bulls sustain their tempo run and push price through the 0.1900 important resistant level and extend the impressive bullish days they’ve had so far into 1.2000.
Market Prospects
Taking an objective look at the H4, we can see the MACD (Moving Average Convergence Divergence) bearish divergence pattern that began to form on the 21st of July 2021. The bearish divergence here indicates that even though price kept making consistently higher highs since 21st July, the actual volume of orders driving the bullishness kept reducing. This shows that the bull price run has not corresponded with an equivalent volume increase. Hence, the bullish run appears weak on the H4 with a bearish MACD divergence pattern showing up.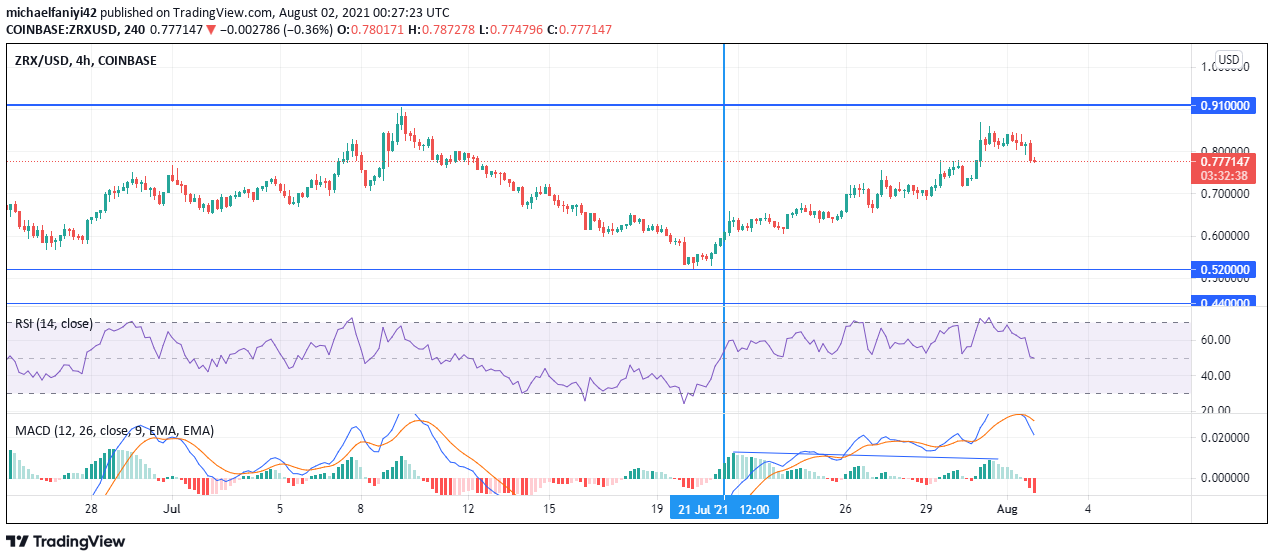
With price approaching an important historical resistance point and the RSI indicator on the daily chart showing price is approaching an overbought region, the daily chart looks primed for a reversal and downward trend. The H4 also confirms this bias, with the MACD bearish divergence that began forming on the 21st of July suggesting that the bullish steam might just have finished, and hitting the important resistance point of 0.1900 might turn price around and take out further downward objectives, 0.5200 probably.
You can purchase crypto coins here: Buy Tokens
Note: Cryptosignal.org is not a financial advisor. Do your research before investing your funds in any financial asset or presented product or event. We are not responsible for your investing results.