0x (ZRXUSD) Slides Into Bearish Territory as It Fails to Hold Above a Key Level
Estimated Reading Time: 3 minutes
Don’t invest unless you’re prepared to lose all the money you invest. This is a high-risk investment and you are unlikely to be protected if something goes wrong. Take 2 minutes to learn more
ZRXUSD Analysis – Price Slides Below $1.100 to Plunge Into Bearish Territory
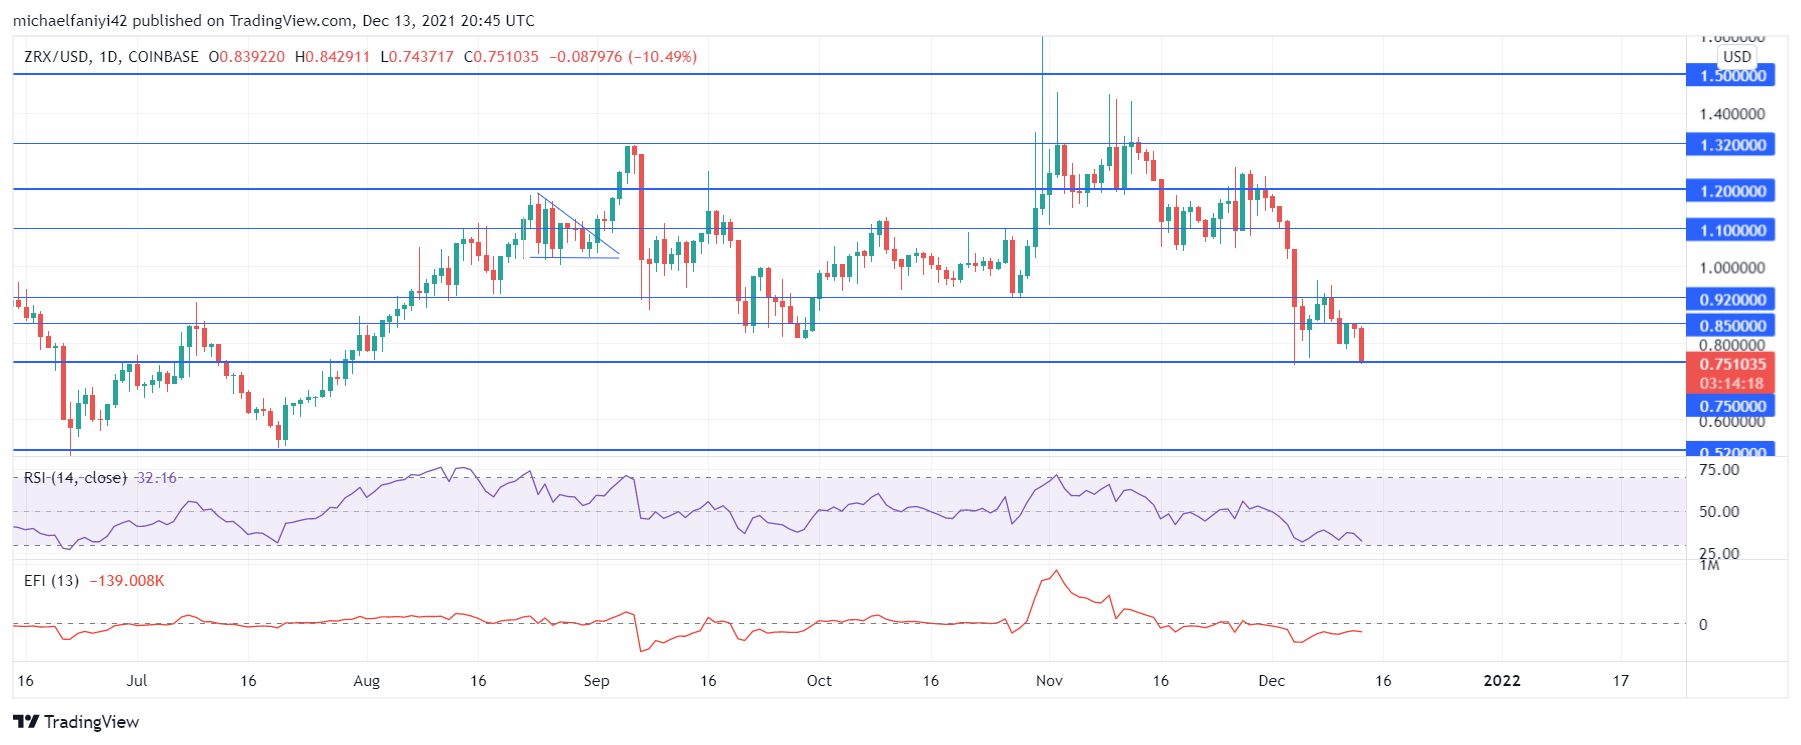
ZRXUSD slides into bearish territory after it falls below the $1.100 significant level. The coin slides below to this significant level on the 16th of November. Thereafter, the market can be seen fluctuating at this level, with the buyers possessing more market strength. There was even a false breakout back to $1.200 before the price embarked on a definite plunge, breaking through the $1.100 and other intermediary price levels to reach $0.750.
ZRXUSD Significant Levels
Resistance Levels: $1.500, $1.320, $1.200
Support Levels: $0.520, $0.750, $1.100
It has been all downward for the coin since the 31st of October when the price surged above the $1.200 key level. Despite the buyers’ best efforts, the market failed to overcome the opposition that limited it to $1.320. Several candlestick wicks were seen piercing above the level to show the market’s willingness to traverse upward. A retest and a push-up from $1.200 didn’t help matters either. Therefore, the price slides below to $1.100 on the 16th of November.
It was only a matter of time before ZRX would find itself in bearish territory. It fluctuates for some days and then slides further down. Though it bounced off $0.750 immediately, it is now trapped below $0.920. The coin is now dropping towards $0.750 again. The Elders Force Index is at a negative value, showing the current influence of the sellers. The coin is as near oversold as the Relative Strength Index has its signal line currently at the 33 mark.

Market Prospects
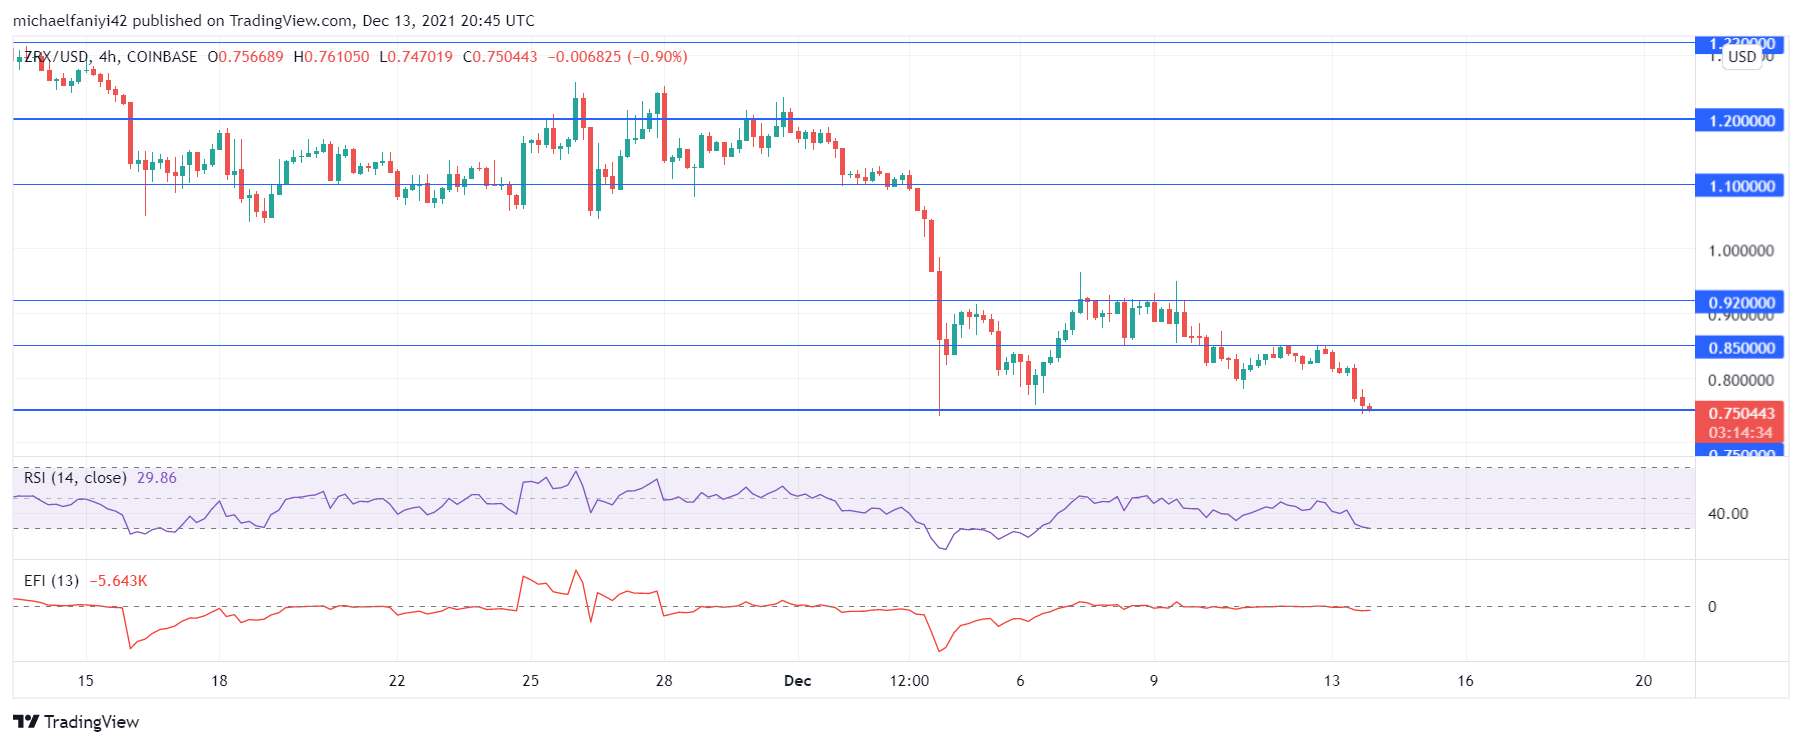
The 4-hour chart shows the EFI rising to equilibrium at some point to show the bulls’ effort in the market. However, ZRXUSD has dropped off again, back to a negative value on the EFI chart. The RSI indicator remains largely in the bearish half of the chart, and it is dropping off further towards the oversold border once more. The coin is very likely to break further to reach $0.520.
You can purchase crypto coins here: Buy Tokens
Note: Cryptosignals.org is not a financial advisor. Do your research before investing your funds in any financial asset or presented product or event. We are not responsible for your investing results.