0x (ZRXUSD) Suffers Further Decline After Failure at a Critical Resistance
Estimated Reading Time: 3 minutes
Don’t invest unless you’re prepared to lose all the money you invest. This is a high-risk investment and you are unlikely to be protected if something goes wrong. Take 2 minutes to learn more
0x Analysis – Price Suffers Further Drop After Rejection at $1.200
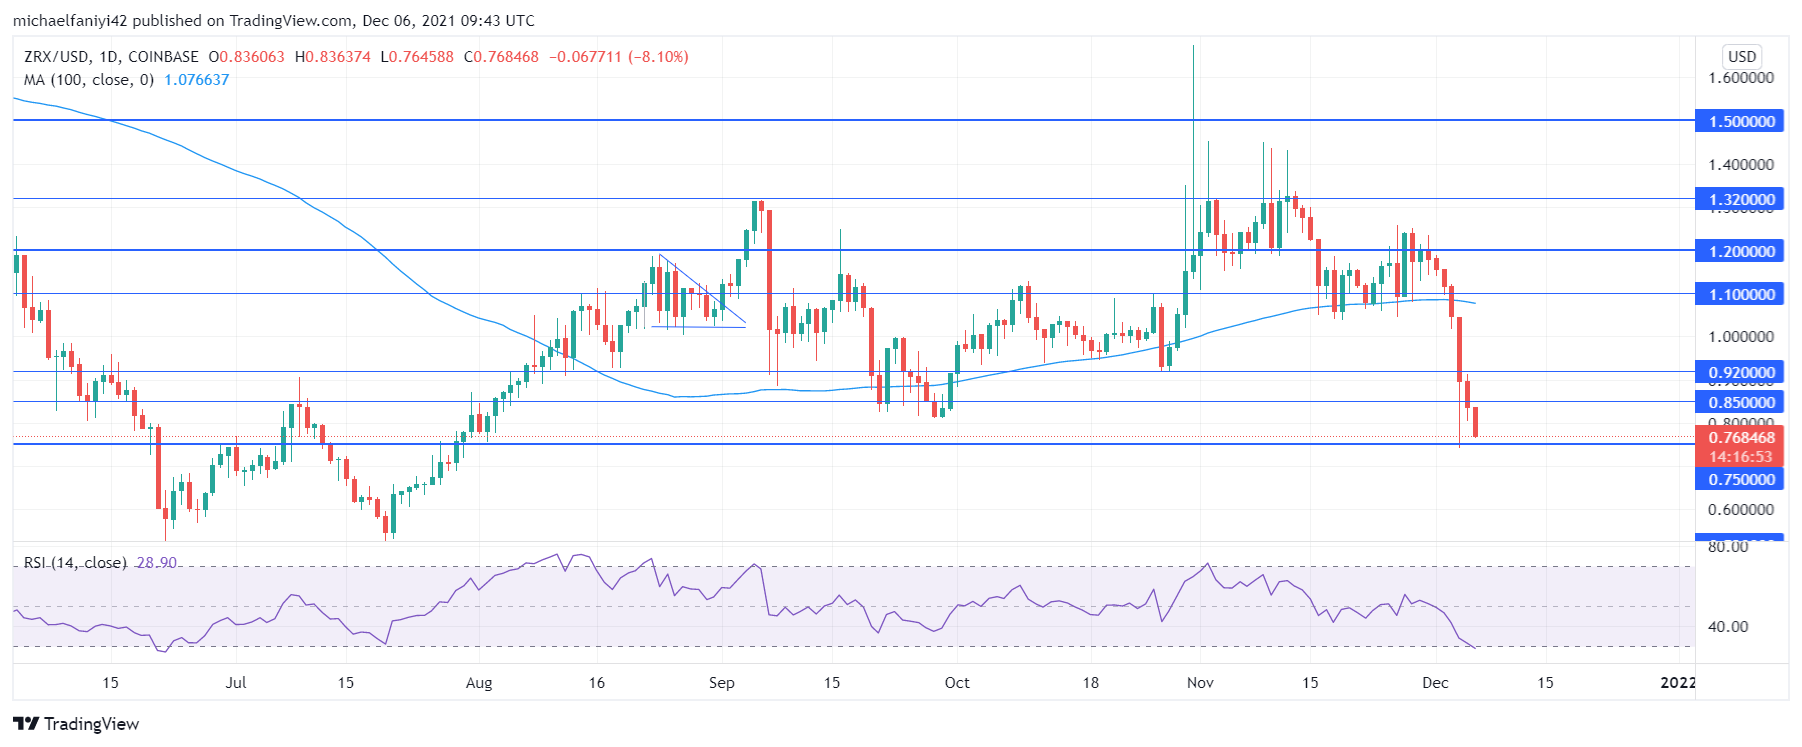
0x suffers further decline after it fails to get the better of the $1.200 key resistance level. The coin can be seen hanging on around the $1.100 price level, intending to use it as a springboard to regain its position above the $1.200 significant level. The market indeed forced its way through, but it was short-lived, and not only did the price slip back below it, but it suffers a further decline. ZRX has now dropped precipitously to below $0.850.
0x Significant Levels
Resistance Levels: $1.200, $1.320, $1.500
Support Levels: $0.520, $0.750, $1.100
In recent times, bulls can be seen battling for and having prominence in the market. Despite all the setbacks, ZRX made some headway on the 28th of October, such that its price rose very highly in the space of a few days. However, a very strong opposition put a limit on the market at 1.320. The bullish impetus was thus limited to only long wicks that rose very highly from the level. The coin would remain below this level for the next two weeks to keep punching at it, hoping that it might give way.
The opposite happened instead, as it was the market that weakened and was subdued below the $1.200 key level. The Bulls then used the $1.100 level as a hold to get back upwards. This they did for more than 10 days, but they were at best only able to muster a false breakthrough. The coin soon slipped through $1.100 and suffered a further decline, breaking through the MA period 100 (Moving Average), which has largely been keeping it up.

Market Analysis
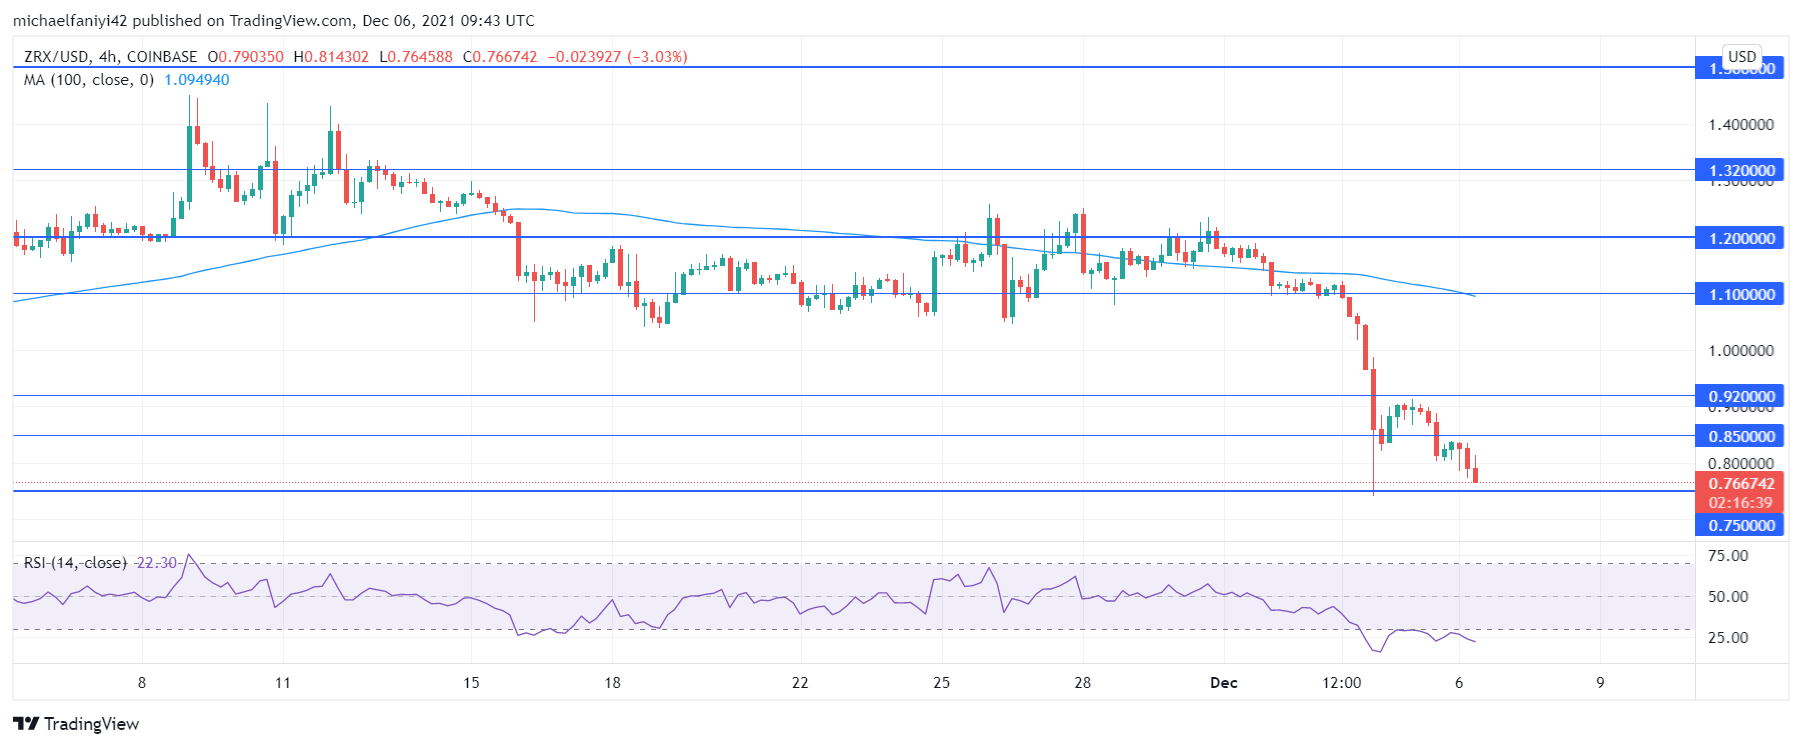
On the 4-hour chart, having crashed through the MA period 100, the market touched down at $0.750 with a long wick. Next, it pulls back to retest $0.920, after which there is a further drop back towards $0.750. The bears are strongly in the dominance of the market and the RSI (Relative Strength Index) indicator has plunged deep into the oversold region below the 25 mark.
If the coin manages to break through $0.750, it will be on its way to $0.52, where the market began about 5 months ago.
You can purchase crypto coins here: Buy Tokens
Note: Cryptosignals.org is not a financial advisor. Do your research before investing your funds in any financial asset or presented product or event. We are not responsible for your investing results.