Bancor (BNTUSD) Finds Resistance at $4.400 and Discontinues Its Uptrend Movement
Estimated Reading Time: 3 minutes
Don’t invest unless you’re prepared to lose all the money you invest. This is a high-risk investment and you are unlikely to be protected if something goes wrong. Take 2 minutes to learn more
Bancor Analysis – Price Finds Resistance at $4.400 and Drops Below the Uptrend Line
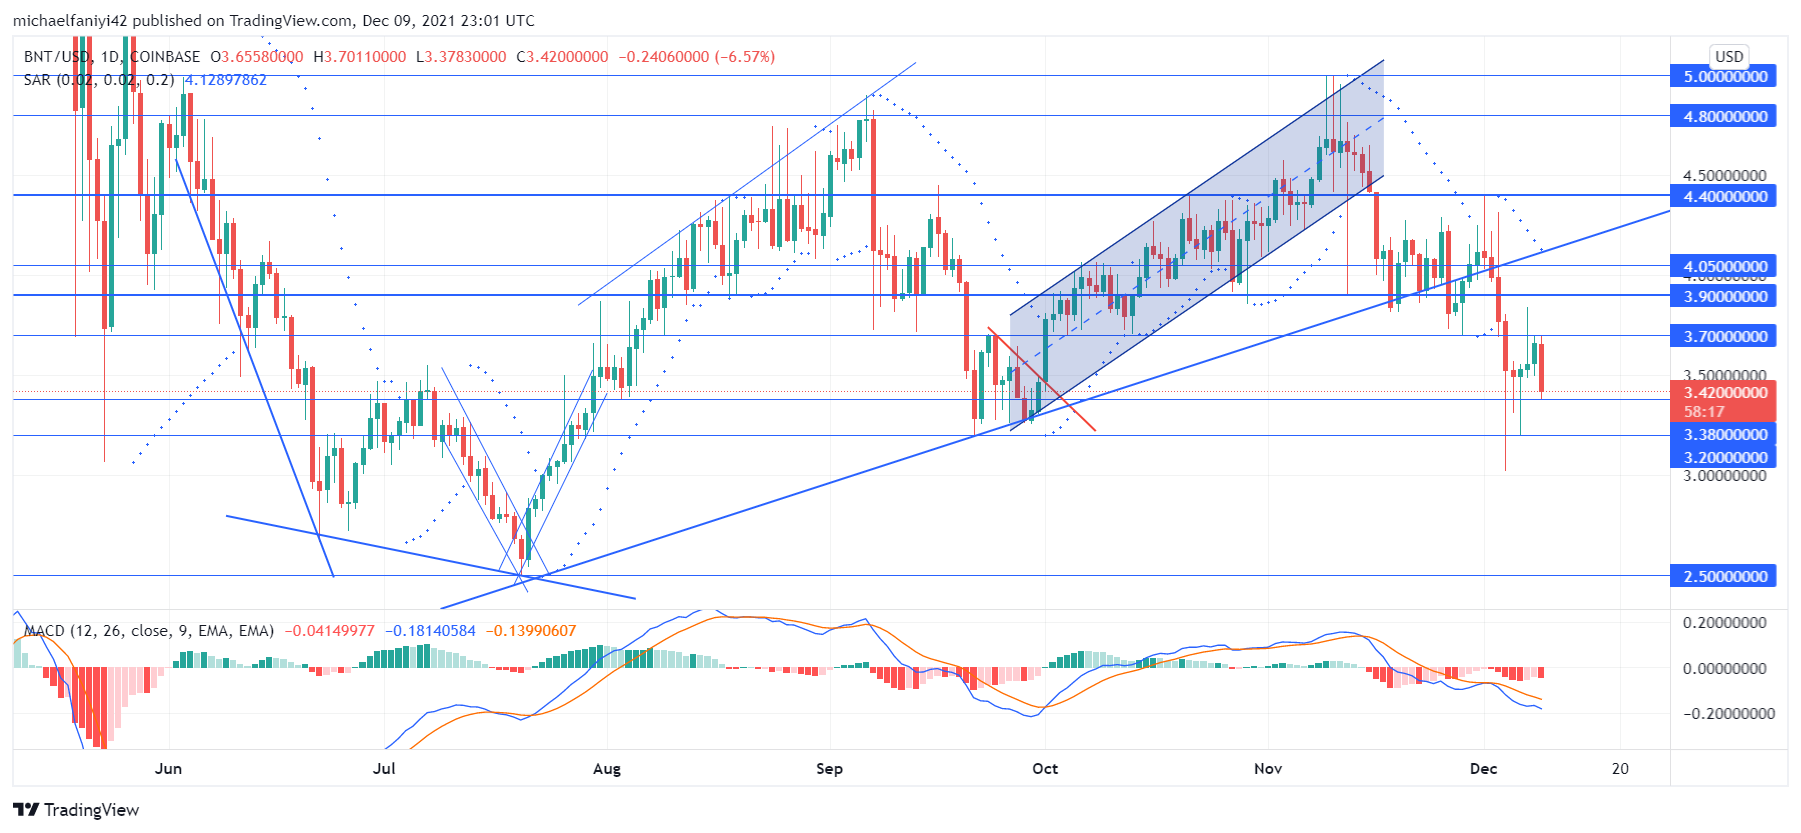
Bancor finds resistance at the $4.400 critical level, slumps below its uptrend line, and eventually discontinues its upward adventure. The coin spent much time fluctuating above $3.900 as its failure to flow upward immediately with the uptrend line grounded it at the price level. The first sign of failure came as the price dropped temporarily below $3.900. Thereafter, Bancor tried to rally upward, but a strong rejection at $4.400 leads to a precipitous market drop below $3.900.
Bancor Significant Levels
Resistance Levels: $5.000, $4.800, $4.400
Support Levels: $3.900, $3.700, $3.380
The coin tried to rise again after it finds resistance around the $4.800 resistance level. The market rose through a parallel channel, conducting itself past several significant levels till it gets back to around $4.800 again. The resistance remained as solid as ever and there was yet another slump that crashed the coin to $3.900. The market is assumed to remain in an uptrend at this point as it drops to a higher low.
The market began agitating above this level, just as it did the previous time. However, it began to take a little longer, and the coin failed to lift itself along the uptrend line. By the time the price tries to move up, it finds strong resistance at $4.400 and slumps abruptly. It falls below $3.200 but quickly rises back above $3.800. The MACD (Moving Average Convergence Divergence) has its lines drop below the middle line, accompanied by bearish histogram bars. This means bears have the upper hand in the market.

Market Anticipation
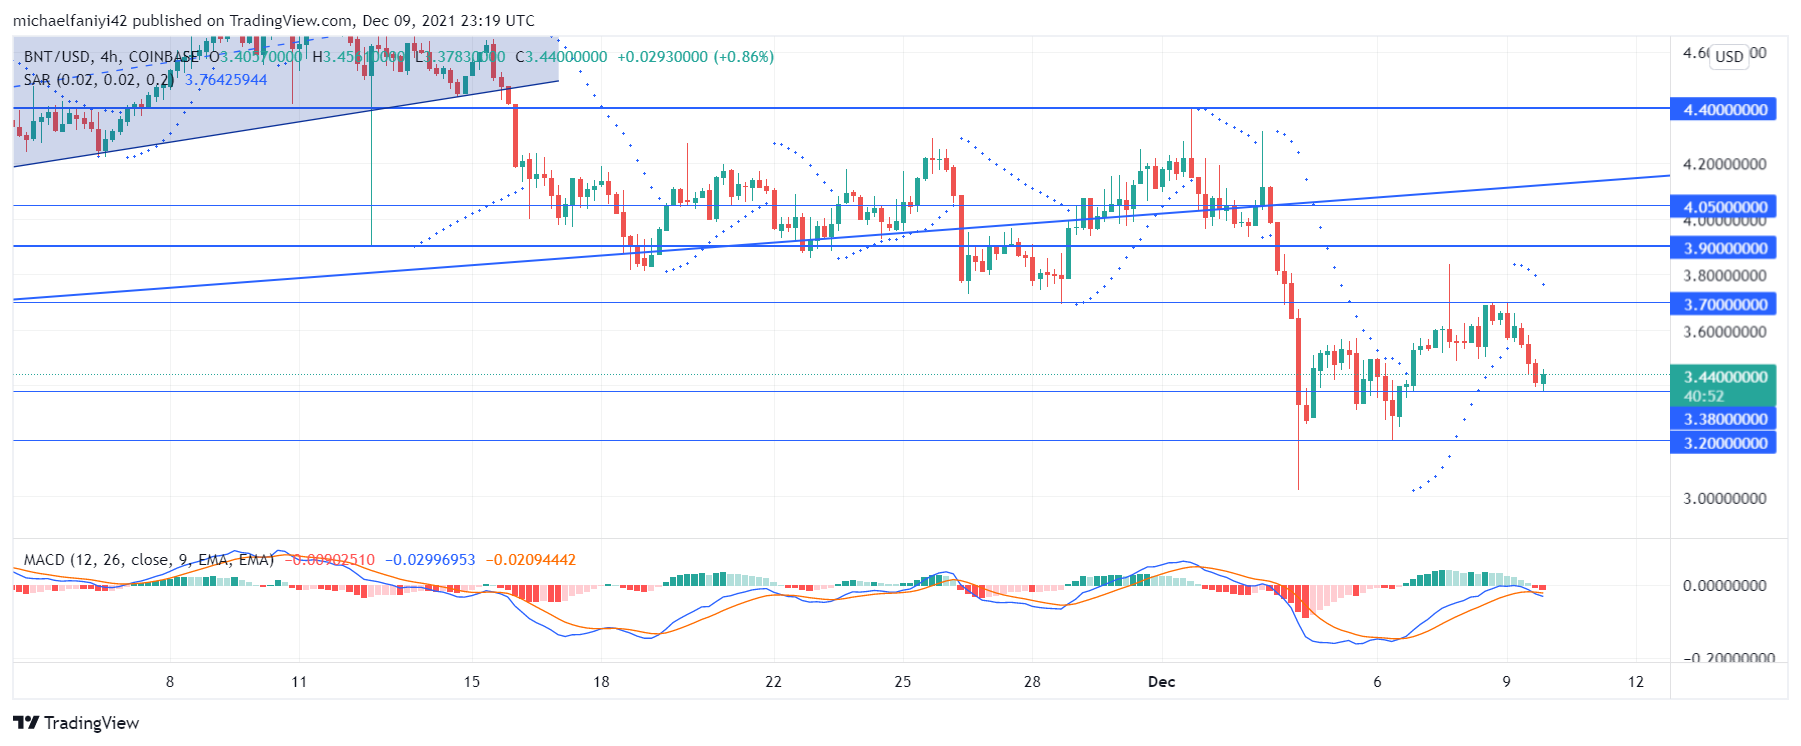
The 4-hour chart shows that the endeavors of the market buyers have been thus far rebuffed at the $3.700 price level. As a result, the Parabolic SAR (Stop and Reverse) has switched above the candles as the price has dropped back to $3.800. The MACD has also switched bearish as there is now a cross downward. Bulls, on the other hand, can be expected to apply upward pressure and bounce to break the $3.700 key level.
You can purchase crypto coins here: Buy Tokens
Note: Cryptosignals.org is not a financial advisor. Do your research before investing your funds in any financial asset or presented product or event. We are not responsible for your investing results.