Band Protocol (BANDUSD) Continues to Fall In the Market
Estimated Reading Time: 2 minutes
Don’t invest unless you’re prepared to lose all the money you invest. This is a high-risk investment and you are unlikely to be protected if something goes wrong. Take 2 minutes to learn more

Free Crypto Signals Channel
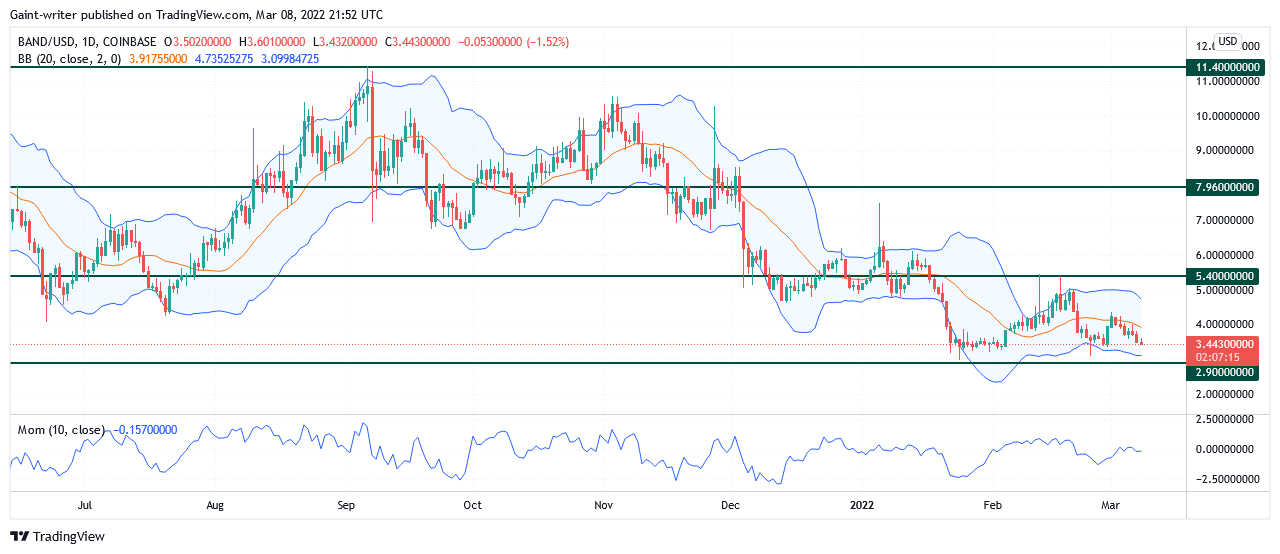
BANDUSD Analysis – Price Continues Its Fall to the $2.900 Key Zone
BANDUSD continues to fall to the $2.900 key zone in the market. The sellers are seen decorating the price influence with a bearish tendency. After a change in the market disposition, the bears’ strength came to life, causing the price to trade downward, creating lower lows and lower highs in the market. When the bears break through a key level, a retest is seen at that level before further bearish movement. This retest gives a bearish confirmation as the market progresses downward.
BANDUSD Market Levels
Resistance Levels: $11.40, $7.960
Support Levels: $2.900, $5.400
Following a market shift around June 2021, BANDUSD turns bullish after forming a “W” shape pattern. The bulls then apprehended the price influence as it rallied up towards the $11.400 significant level. This key level marked the price’s recent all-time high. The buyers’ pursuit ended since there was no readiness to engage the market above the $11.400 key zone.
However, a change in BANDUSD occurred with the price forming two tops and a bottom before a change in the price trend occurred. However, the bearish market occurred after a change in the BANDUSD seasonal inclination. The sellers on display begin to slip the price downward beyond several key levels in the market. The momentum indicator in the market shows price speed as the bears continue to influence the market.

Market Prospect
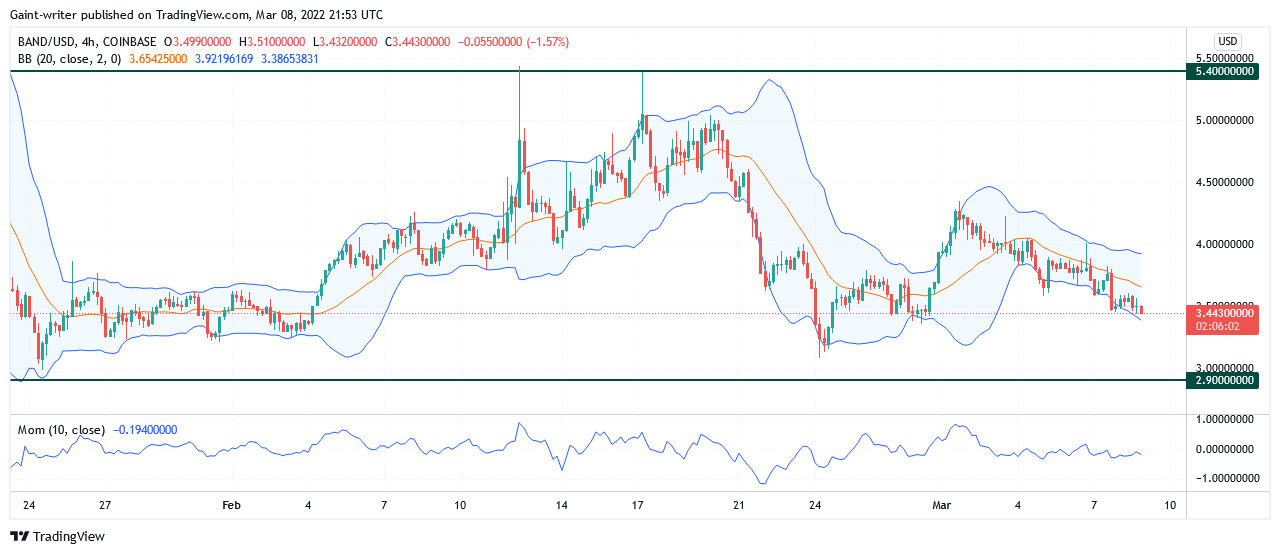
The 4-hour chart time frame displays the price cycle moving from bullish to bearish strength. The sellers are dropping the price by a significant amount to a level near $2.900. However, the Bollinger Band indicators show a slight squeeze as prices trend downward to indicate a bearish presence to break through the $2.900 key level. A plunge below the $2.900 key level should be anticipated.
How To Buy Lucky Block
Note: Cryptosignals.org is not a financial advisor. Do your research before investing your funds in any financial asset or presented product or event. We are not responsible for your investing results.