Band Protocol (BANDUSD) Is Losing Stability as Its Value Declines
Estimated Reading Time: 2 minutes
Don’t invest unless you’re prepared to lose all the money you invest. This is a high-risk investment and you are unlikely to be protected if something goes wrong. Take 2 minutes to learn more

Free Crypto Signals Channel
BANDUSD Analysis: The Market Is Losing Stability as the Value Declines Below the $3.000 Key Zone
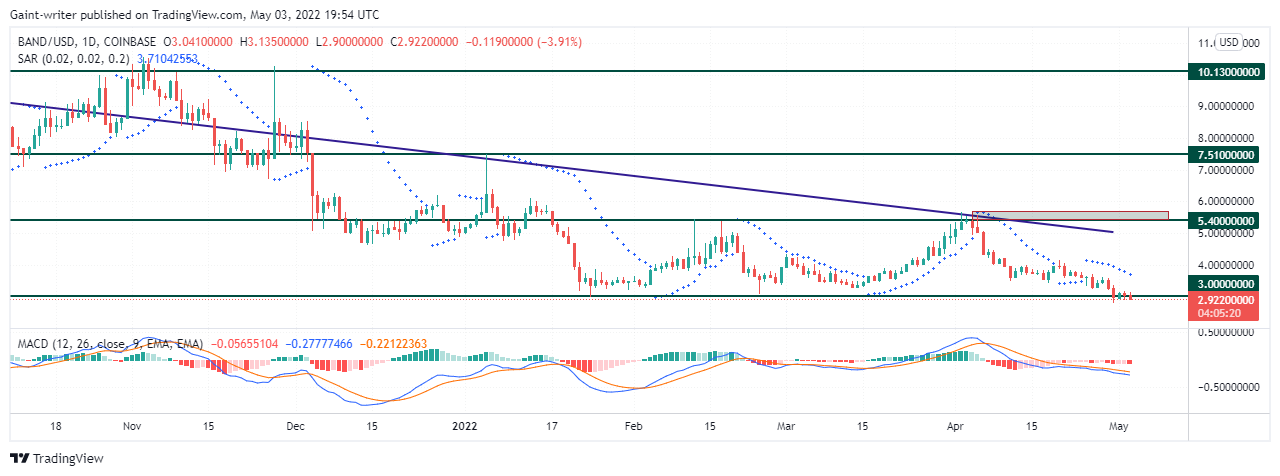
BANDUSD is losing stability as the value declines below the $3.000 key zone. BANDUSD price analysis shows the crypto currency’s price action is declining due to the bearish impact that surrounds its influence. The sellers are systematically approaching the critical level of the crypto market. The buy traders are therefore taking a back seat as the value continues to lose its stability due to the sellers’ influence.
BANDUSD Crucial Levels
Resistance Levels: $10.130, $7.510
Support Levels: $5.400, $3.000
The bearish journey originated from the bull’s unwillingness to escape the trend above the $10.130 significant point. After several attempts by the buyers, there appeared to be tones of rejection at this level. This, however, conveyed a bearish appearance in the market. From this angle, BANDUSD begins to lose its value, and from here the price action keeps declining progressively due to the bearish influence.
As the bears continue to drop on the daily chart, the buyers are not left out either. The value of BANDUSD keeps reacting to the trendline, heeding to the bearish displacement in price. The Parabolic SAR (Stop and Reversal) indicator allows us to see where the general sequence is positioned. The dots point to a bearish displacement in the BANDUSD price. Due to the bearish impact, the price will continue to decline.

Market Expectations
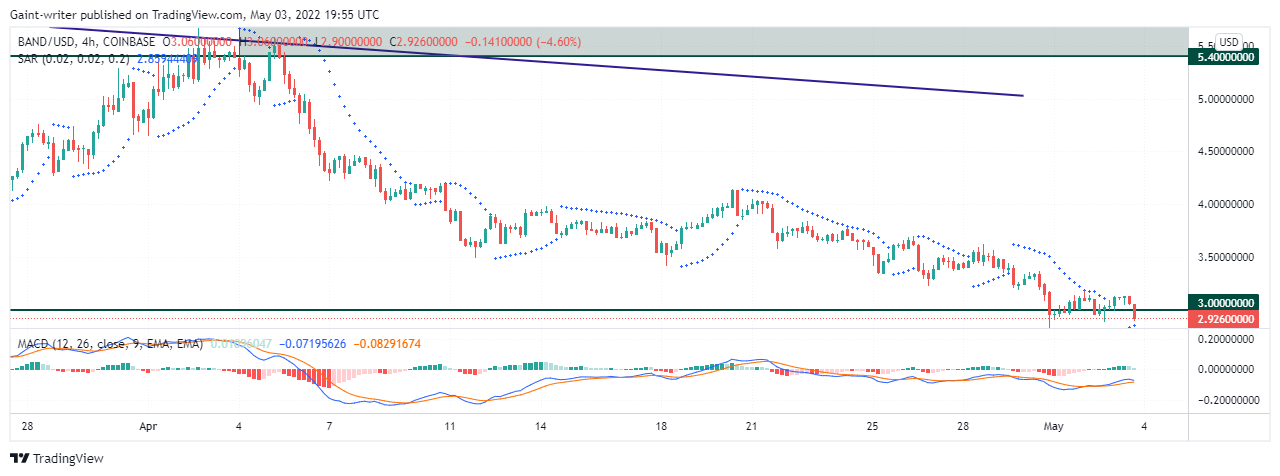
The 4-hour chart reveals the trend of value from the $5.400 key zone due to bearish manipulation down to the $3.000 crucial zone. Buyers have less clout to influence price movement in the short term, as the price is now trading below the $3.000 key zone. The MACD (Moving Average Convergence and Divergence) indicator shows that the price trend is still bearish as the price continues to fall below the $3.000 critical level.
How To Buy Lucky Block
Note: Cryptosignals.org is not a financial advisor. Do your research before investing your funds in any financial asset or presented product or event. We are not responsible for your investing results.