Binance Coin (BNB) Pushes to the Upside, Targets Level $442.46
Estimated Reading Time: 2 minutes
Don’t invest unless you’re prepared to lose all the money you invest. This is a high-risk investment and you are unlikely to be protected if something goes wrong. Take 2 minutes to learn more

Binance Coin (BNB) Long-Term Analysis: Bullish
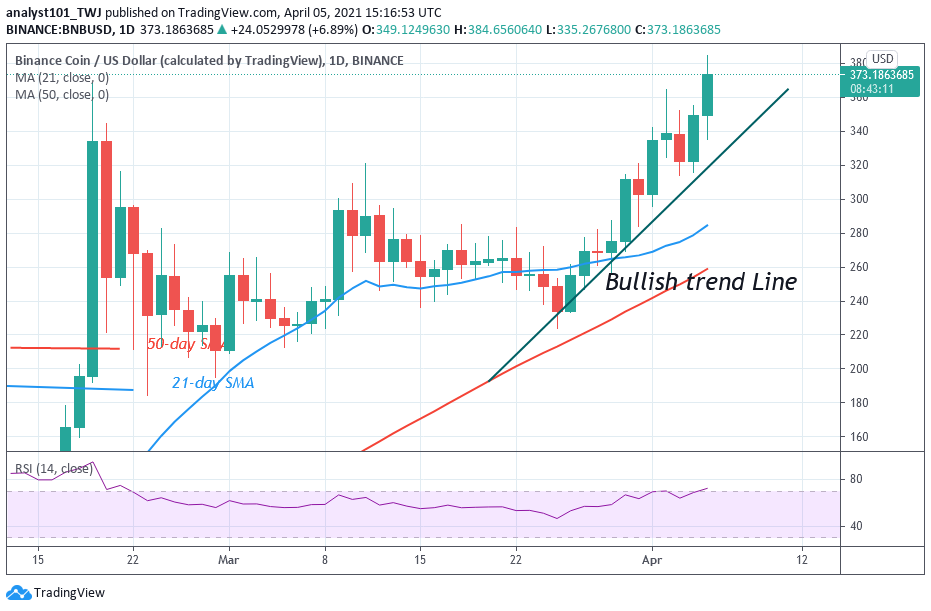
Binance Coin price is making a series of higher highs and higher lows. The bulls broke the resistance at $300 and rallied to $380 high. Since February, the crypto has been trading below the $300 resistance level. Each time, buyers retest the resistance zone, the market will fall either to the low of $200 or $220 support. Nonetheless, the bulls have broken the recent high as the market trend upward. The uptrend is facing resistance at $380. On the upside, if the bulls can clear the recent resistance, the uptrend will continue to $430 high.
Binance Coin (BNB) Indicator Analysis
BNB is at level 72 of the Relative Strength Index period 14. The crypto has reached the overbought region of the market. This indicates that the coin has not enough room to rally on the upside. However, in a trending market, the overbought condition may not hold.
Technical indicators:
Major Resistance Levels – $380, $480, $500
Major Support Levels – $320, $300, $280
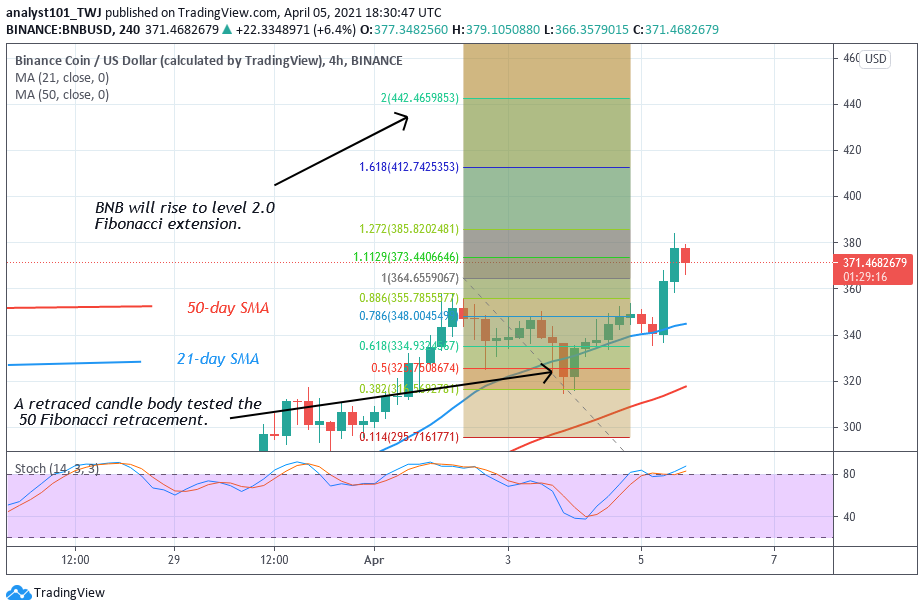
What Is the Next Direction for Binance Coin (BNB)?
The crypto is in an upward move. On the 4 –hour chart, the uptrend was resisted at the high of $360. After a pullback to $320 lows, the uptrend resumes to break the recent high. On April 2 uptrend, a retraced candle body tested the 50% Fibonacci retracement level. This retracement implies that BNB will rise to level 2.0 Fibonacci extensions or the high of $442.46.
Note: cryptosignals.org is not a financial advisor. Do your research before investing your funds in any financial asset or presented product or event. We are not responsible for your investing results