Bitcoin (BTC/USD) Market Develops Supports Subtly Below $26,000
Estimated Reading Time: 3 minutes
Don’t invest unless you’re prepared to lose all the money you invest. This is a high-risk investment and you are unlikely to be protected if something goes wrong. Take 2 minutes to learn more
Bitcoin Price Prediction – June 7
Over a couple of days, a correction featured in the BTC/USD trade to the extent of pushing slightly beyond $26,000, as the crypto market currently develops supports subtly below the value line. High and low-value lines between $27,472.29 and $26,785.05 have been in the trading rooms with a negative percentage rate of 1.21. In the meantime, a move to the downside is featuring from a notable spot of around $26,989.21 to signify the need for the buyers to exercise caution in their longing positions, especially if the moves tend to visit back the support point in question.
BTC/USD Market
Key Levels:
Resistance levels: $28,000, $29,000, $30,000
Support levels: $26,000, $25,000, $24,000
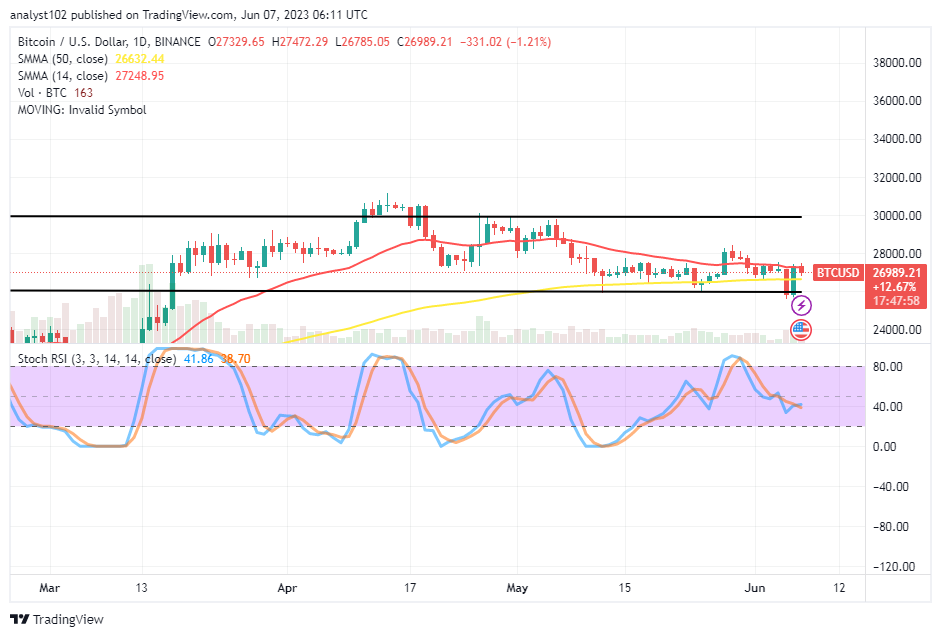
BTC/USD – Daily Chart
The BTC/USD daily chart reveals the crypto market develops support subtly below $26,000 during yesterday’s session. To make up for the conclusion of the previous southerly retracement, trading activity on the fifth day of this month resulted in a bearish candlestick. The 14-day SMA indicator is around $27,248.95 above the $26,632.44 point of the 50-day SMA indicator. The Stochastic Oscillators have positioned slantingly southbound around the 40 to place between 38.70 and 41.86 points to signal that a rising is slowing down.
Is there a potential that the bears in the BTC/USD trade will push back and try to retest the bottom around the prior low of $26,000?
The current gravitational force in the BTC/USD trade operations back to the bottom of around the prior low of $26,000 may not achieve abruptly as the crypto-economic market develops supports subtly below the point. The emergence of yesterday’s bullish candlestick from the support value line has created a sign for bulls to leverage their entries alongside its pathway. But, they needed to be wary of a fearful sustainable retracement against the worth line in the headline.
On the downside of the BTC/USD technical analysis, a renewed declining effort may stage against the recent valuation-rising mood around the trend line of the 14-day SMA at $27,248.95. However, sellers will be on the edge of losing the trades they performed around the indicator’s value toward the resistances between $29,000 and $30,000 in the long run if bulls push the price back against it.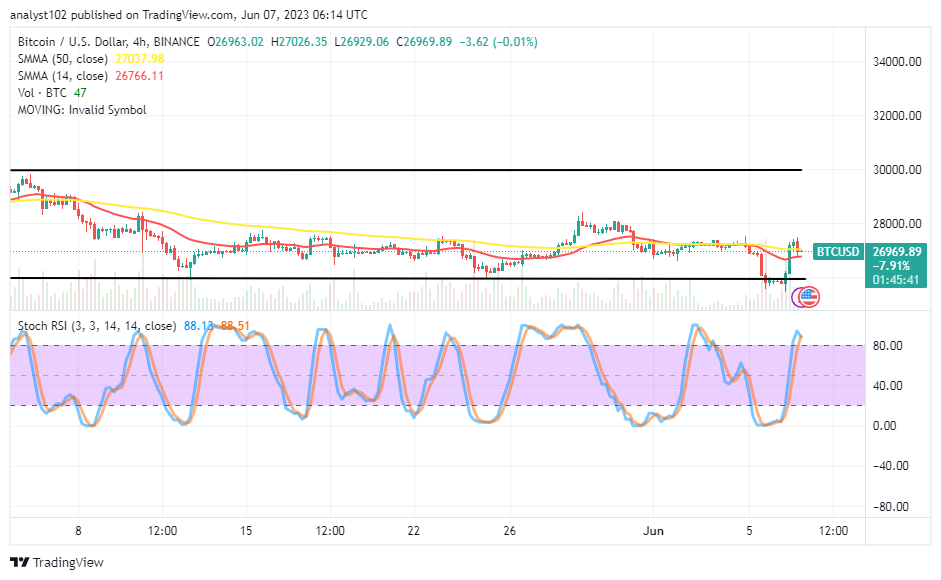
BTC/USD 4-hour Chart
The BTC/USD medium-term chart reveals the crypto market has developed support subtly below $26,000. That would be the third time the price aimed to either push toward or break down between the sessions of 12th May until yesterday. The 14-day SMA indicator is at $26,766.11, above the $27,037.98 value line of the 50-day SMA indicator. The Stochastic Oscillators have stepped northbound into the overbought region to position from 88.51 to 88.13, indicating that a reduction might crop in for a while. Based on that, buyers may exercise some patience before launching back into the market, using the marginal forecast propensity of the Oscillators at their lower level readings afterward.
Note: Cryptosignals.org is not a financial advisor. Do your research before investing your funds in any financial asset or presented product or event. We are not responsible for your investing results.
You can purchase Lucky Block here. Buy LBLOCK