Bitcoin (BTC/USD) Market Is Moving in a Downward Direction
Estimated Reading Time: 3 minutes
Don’t invest unless you’re prepared to lose all the money you invest. This is a high-risk investment and you are unlikely to be protected if something goes wrong. Take 2 minutes to learn more
Bitcoin Price Prediction – May 31
The BTC/USD market is moving in a downward direction at the time of writing this technical piece. The transactions have witnessed between the value lines of $27,902.08 and $27,092.72. The market’s rate of percentage is at 2.28 negatives. The current gravity to the downside may not be in a mode to the extent of aggressively beyond the previous low point obtained around the $26,000 support line. We believe sellers’ reactions won’t force the trend back into a consistent drawback trend in the long run.
BTC/USD Market
Key Levels:
Resistance levels: $28,000, $29,000, $30,000
Support levels: $26,000, $25,000, $24,000
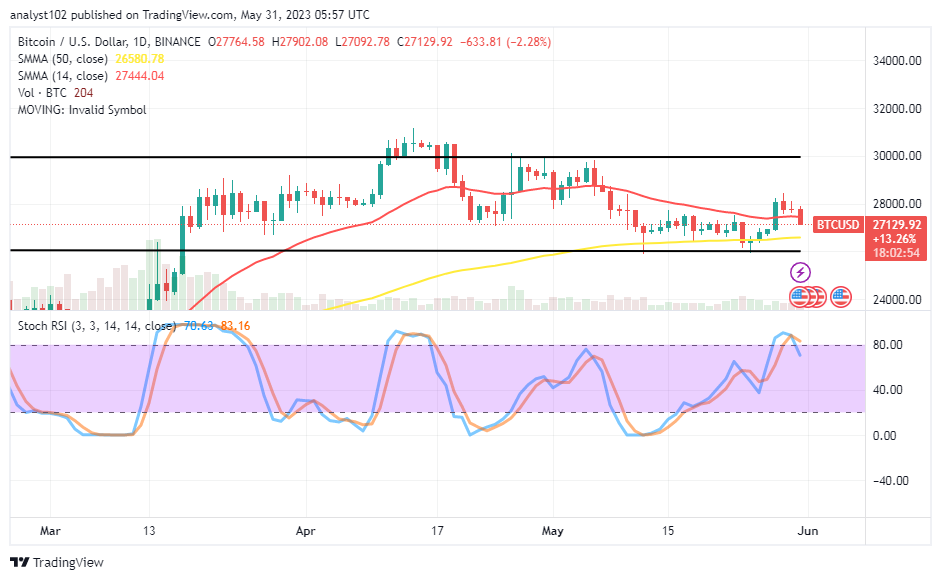
BTC/USD – Daily Chart
The BTC/USD daily chart reveals the crypto market is moving in a downward direction against the US Dollar because buyers failed to surge further over the resistance level of $28,000 about three days ago. The 14-day SMA trend line is at a $27,444.04 value line over the $26,580.78 point of the 50-day SMA trend line. The Stochastic Oscillators have briefly breached the 80 into the overbought region before maintaining a southbound-crossing mode at 83.16 to 70.63 to signify that a fall in the valuation of the crypto is ongoing.
Should sellers in the BTC/USD market attempt to break past support below the $26,000 lower range point?
It is technically not advisable for the BTC/USD trade short-position placers to opt for more low points if the price eventually pushes to the $26,000 support line, as the crypto market is moving in a downward direction through the 14-day SMA at this moment. The motion must be exhausted before buying activities can resume, with a production trading signal—a bullish candlestick—following.
On the downside of the BTC/USD technical analysis, shorting operation is actively tentative in its moving approach, which could lead to an upward reversal. Sellers wishing to initiate an immediate sell order concurrent with the trend must safeguard their position near the $29,000 barrier.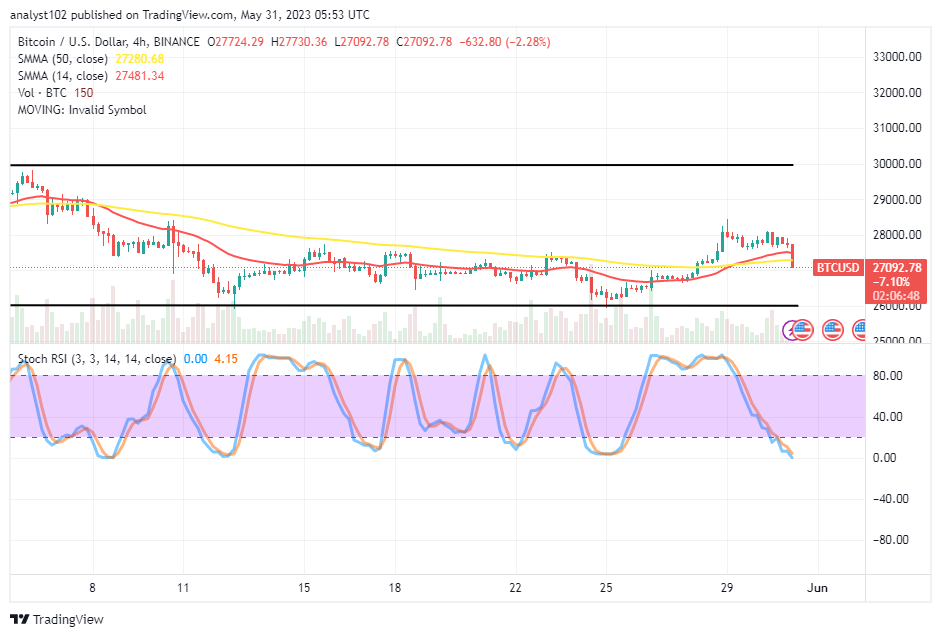
BTC/USD 4-hour Chart
The BTC/USD medium-term chart reveals the crypto-economic market is moving in a downward direction of the SMA trend lines. The 14-day SMA indicator is at $27,481.34 above the $27,280.68 value of the 50-day SMA indicator. The Stochastic Oscillators have dipped southbound into the oversold region, keeping the points of 4.15 to 0.00. That implies the velocity backing the motion is heading to a completion stage. However, at least two 4-hour bullish candlesticks must emerge from a lower trading zone to support that supposition.
Note: Cryptosignals.org is not a financial advisor. Do your research before investing your funds in any financial asset or presented product or event. We are not responsible for your investing results.
You can purchase Lucky Block here. Buy LBLOCK