Bitcoin (BTC/USD) Price Holds a Ranging Session Above $26,000
Estimated Reading Time: 3 minutes
Don’t invest unless you’re prepared to lose all the money you invest. This is a high-risk investment and you are unlikely to be protected if something goes wrong. Take 2 minutes to learn more
Bitcoin Price Prediction – May 24
The BTC/USD price holds a ranging session above the $26,000 support line, expecting to lead to a chain of indecision mood between the two market controllers. A series of smaller-active moves to the upside and downside has been between $27,235.83 and $26,651.10 at an average of 1.70 percent negative. Some days will likely run by to let buying activities regain their proper shape pattern around the axis of the point in question before resuming an upward push.
BTC/USD Market
Key Levels:
Resistance levels: $28,000, $29,000, $30,000
Support levels: $26,000, $25,000, $24,000
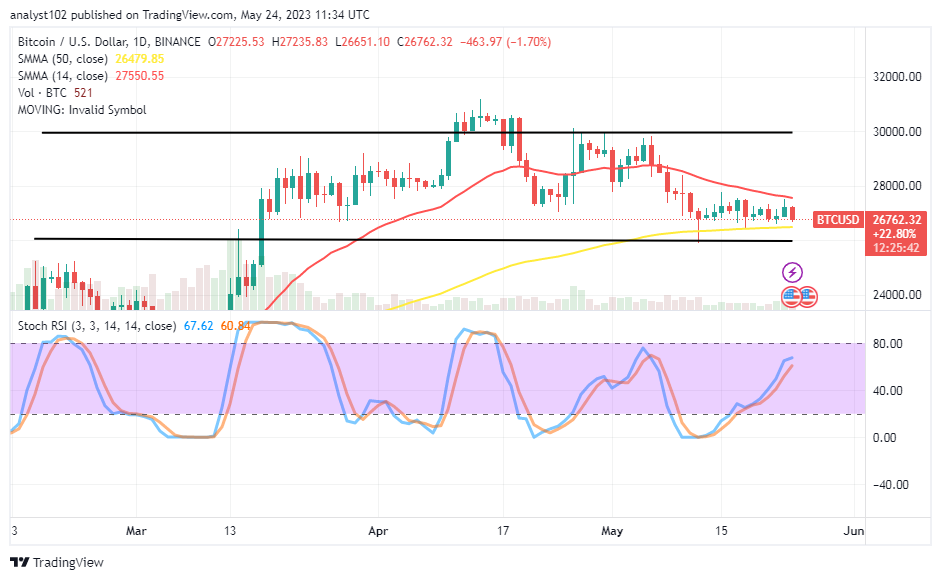
BTC/USD – Daily Chart
The BTC/USD daily chart reveals the crypto-economic price holds a ranging session above the $26,000 support level. The value line stands a risk of serving as the pivotal spot to the manner and way the market has been pushing, as the 14-day SMA indicator is at $27,550.55 over the $26,479.85 value of the 50-day SMA indicator. Between 60.84 and 67.62, the Stochastic Oscillators are slantingly traveling northbound direction. Technically speaking, they may shortly close their lines to confirm the likelihood of experiencing some lows.
When deciding when to open a position, will it be more psychologically ideal to follow the BTC/USD Stochastic Oscillators?
The BTC/USD Stochastic Oscillators are going to play vital roles in the decision of when to place an order, coupling with the specific active force a trading candlestick might tend to be showing at a given time as the crypto-economic price holds a ranging session above the $26,000 support line. A circumstance where the Oscillators predict pointing back to the north from lower levels tends to receive ascending velocity later in addition to that supposition.
On the downside of the BTC/USD technical analysis, a degree of falling pressure is tentatively ongoing, devoicing a clear-cut shorting positioning entry. That implies sellers have not been able to possess so much prevailing stance against buyers. Long-position placers have a greater chance of pulling up back if the activities of bears fail to exert forces downward against the line in question in the long run.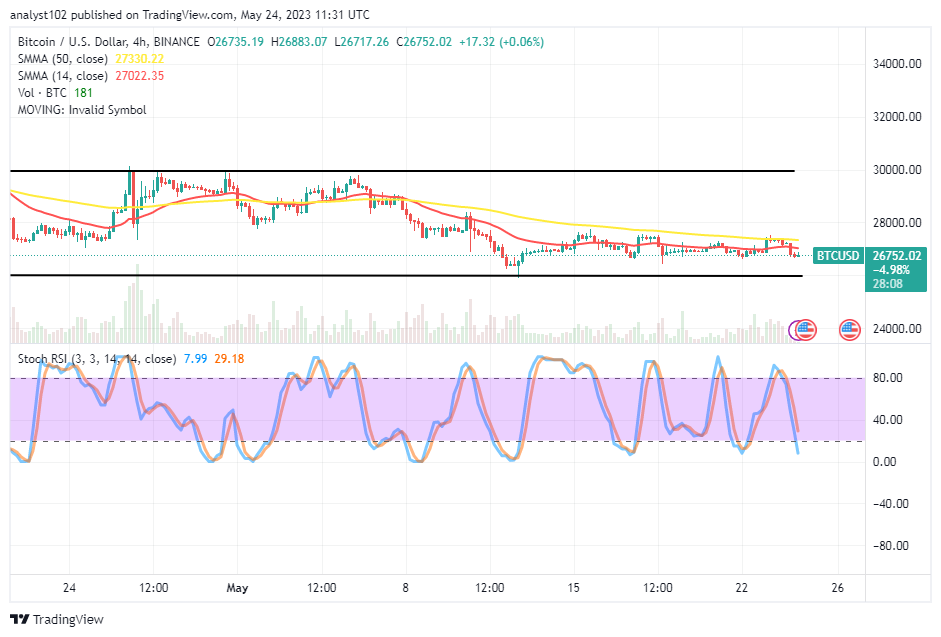
BTC/USD 4-hour Chart
The BTC/USD medium-term chart reveals the crypto-economic price holds a ranging session above the $26,000 support level. During the 12th operation of this month, the market managed to drop closely to test the value line before swinging back upward. The 14-day SMA indicator is underneath the 50-day SMA indicator with a small space. The Stochastic Oscillators maintain levels of 29.18 and 7.99, indicating that a drop is progressing toward completion while sinking southward in the oversold region.
Note: Cryptosignals.org is not a financial advisor. Do your research before investing your funds in any financial asset or presented product or event. We are not responsible for your investing results.
You can purchase Lucky Block here. Buy LBLOCK