Ripple (XRP) Rebounds Above $0.88 Support, Poises for Upward Move Soon
Estimated Reading Time: 2 minutes
Don’t invest unless you’re prepared to lose all the money you invest. This is a high-risk investment and you are unlikely to be protected if something goes wrong. Take 2 minutes to learn more

Ripple (XRP) Long-Term Analysis: Bearish
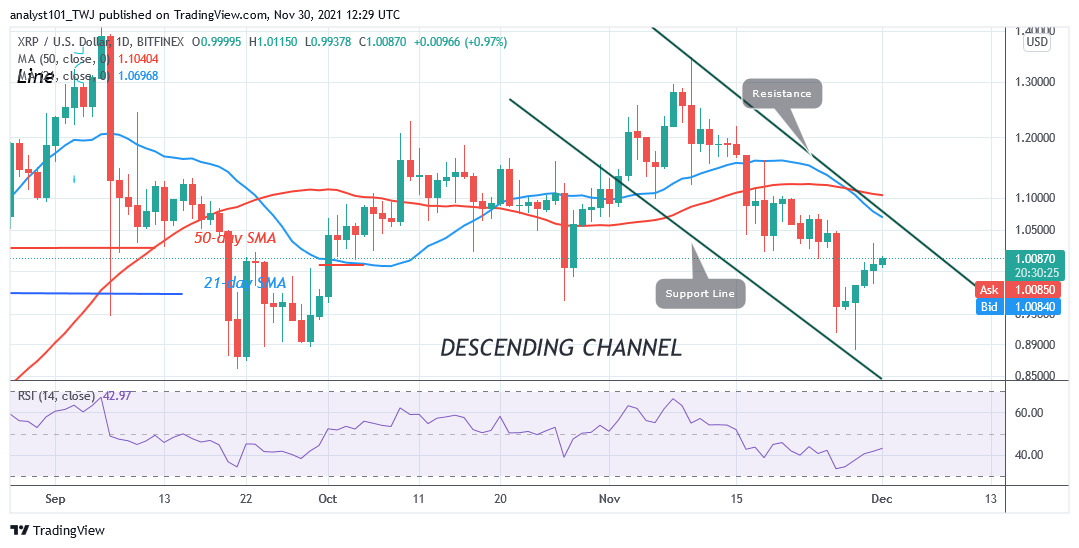
Ripple’s (XRP) price has rebounded above the $0.88 support to resume an uptrend. The bears tested the previous low of $0.85 before the recent uptrend. Buyers have to push XRP above the moving averages or $1.10 resistance to resume upside momentum. XRP is rising on the upside as the altcoin reaches the high of $1.00. The current uptrend is likely to face resistance at the high of $1.10. A break above $1.10 resistance will catapult XRP out of downward correction.
Ripple (XRP) Indicator Analysis
The crypto’s price bars are still below the 21-day line and 50-day line moving averages but XRP has rebounded above the current support. XRP is at level 41 of the Relative Strength Index for period 14. The crypto is in the downtrend zone and below the centerline 50. Ripple is above 40% area of the daily stochastic. The market has resumed bullish momentum.
Technical indicators:
Major Resistance Levels – $2.00, $2.50, $3.00
Major Support Levels – $1.50, $1.00, $0.50
What Is the Next Direction for Ripple (XRP)
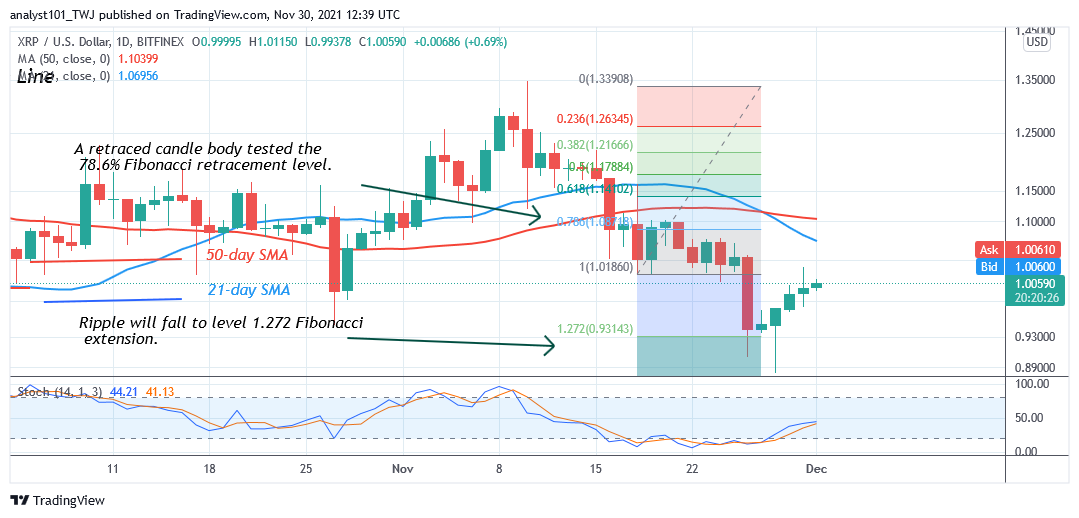
XRP/USD is expected to resume upward as price reaches bearish exhaustion. Ripple fell to $0.90 low and resumed an uptrend. Meanwhile, on November 18 downtrend; a retraced candle body tested the 78.6% Fibonacci retracement level. The retracement indicates that XRP price will fall but reverse at level 1.272 Fibonacci extensions or $0.93.
You can purchase crypto coins here. Buy Tokens
Note: Cryptosignals.org is not a financial advisor. Do your research before investing your funds in any financial asset or presented product or event. We are not responsible for your investing results