Bitcoin (BTC/USD) Market Prepares for a Bullish Breakout As Downtrend Ends
Estimated Reading Time: 3 minutes
Don’t invest unless you’re prepared to lose all the money you invest. This is a high-risk investment and you are unlikely to be protected if something goes wrong. Take 2 minutes to learn more

Bitcoin Price Prediction – April 3
BTCUSD market prepares for a bullish breakout as the downtrend ends. A bullish rally is expected after a sell-side liquidity grab below $79,890 swing low.
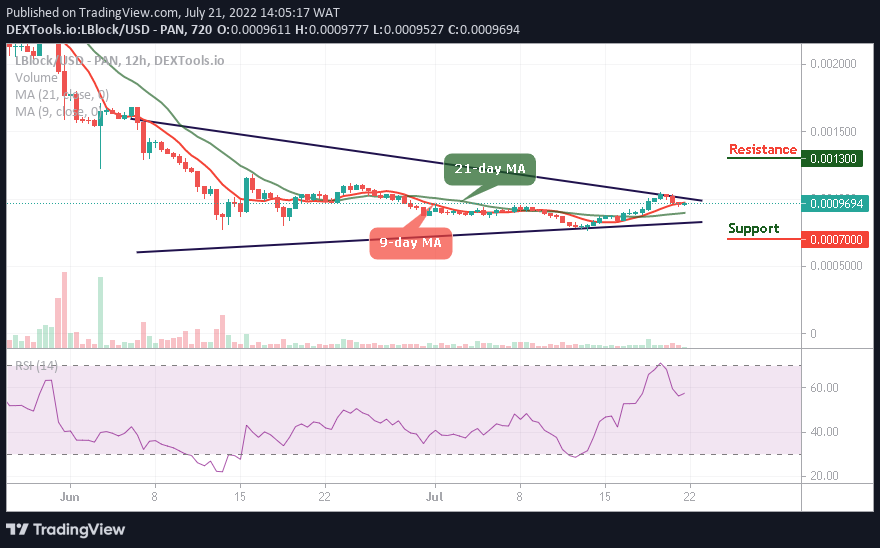
The BTCUSD daily chart displays key indicators signaling a potential bullish move. The 9-day Simple Moving Average (SMA) is currently at $83,970, and the price is slightly below it at $82,030. This suggests a possible retest before an upward movement. The Stochastic Oscillator, currently at 26.39 and 11.13, indicates that BTCUSD is in an oversold region, hinting at a potential bullish reversal. Historically, when the Stochastic Oscillator reaches such low levels, BTCUSD has often experienced price recoveries, making this an important factor for traders anticipating upward momentum.
BTC/USD Market Key Levels:
Resistance Levels: $100,000, $108,390, $115,000
Support Levels: $79,890, $66,780, $53,500

BTC/USD – Daily Chart
The BTCUSD daily chart shows that the market is currently consolidating within a triangle pattern.
BTCUSD recently found support at around $79,890 after a strong selloff and bounced back, indicating demand at lower levels. The downtrend was marked by a descending trendline, which BTCUSD is currently testing near the $85,010 previous resistance zone.
The previous swing low at $79,890 represents a potential liquidity grab before an upward surge. Additionally, an order block around $79,890 was tapped, suggesting that smart money could be accumulating positions for a move higher. If BTCUSD breaks above the diagonal resistance, it may confirm the end of the bearish phase.
What is the likely projection of BTCUSD?
Looking forward, BTCUSD is primed for a bullish breakout if it successfully breaches the diagonal resistance. The next major target would be the psychological resistance at $100,000. A successful break and retest of $85,010 could send BTCUSD toward $100,000 in the coming weeks.
On the downside, if price rejects $85,010 again, a retest of the $79,890 support level may occur before another attempt at a breakout. However, given the oversold stochastic levels and trendline breakout attempts, the bias remains bullish.

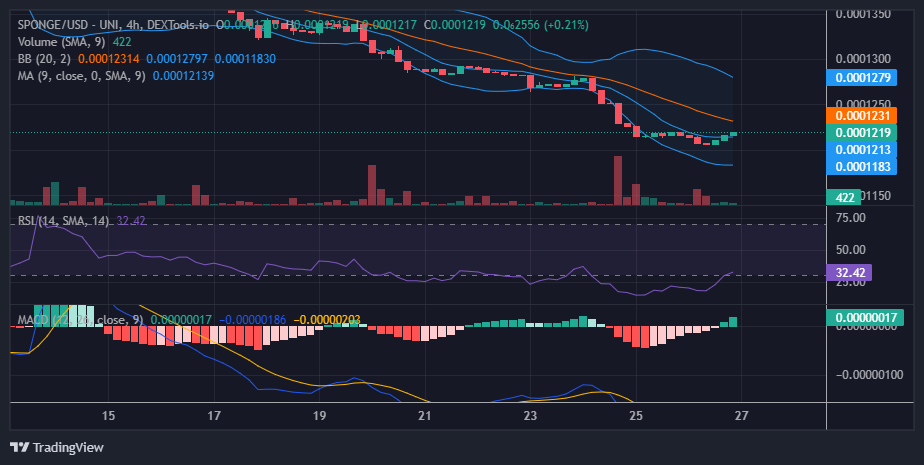
BTC/USD – Four-Hour Chart
BTCUSD is currently trading near the $79,890 support level, which has previously acted as a strong demand zone. The Stochastic Oscillator is in the oversold region, suggesting a potential bullish reversal. If BTCUSD successfully breaks above the diagonal resistance, the next upside target is around $100,000, aligning with previous price reactions.
Bitcoin (BTC) Current Statistics
The current price: $82,030
Market Capitalization: $1,630,000,000,000
Trading Volume: $39,560,000,000
You can purchase Bitcoin here. Buy BTC