Bitcoin Cash (BCH/USD) Price Flutters at $600
Estimated Reading Time: 3 minutes
Don’t invest unless you’re prepared to lose all the money you invest. This is a high-risk investment and you are unlikely to be protected if something goes wrong. Take 2 minutes to learn more
Bitcoin Cash Price Prediction – October 29
The BCH/USD price flutters around the level of $600 as there had been a momentary decline in the crypto market valuation about a couple of days back now. The market now trades around $580 at a percentage rate of about 0.37 positive.
BCH/USD Market
Key Levels:
Resistance levels: $700, $800, $900
Support levels: $500, $400, $300
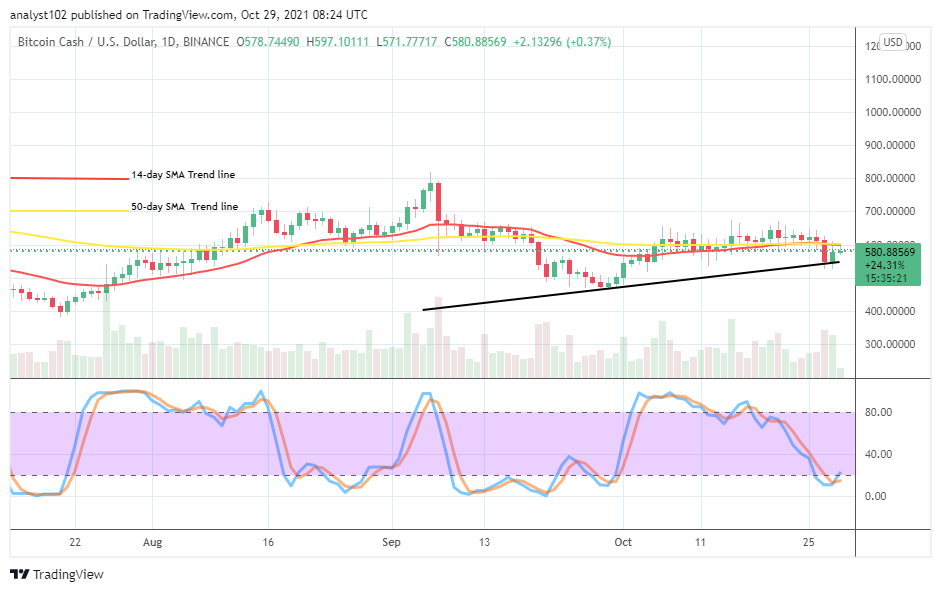
BCH/USD – Daily Chart
The daily chart shows that the crypto-economic price flutters at $600. A bearish candlestick occurred on October 27, almost nudging the market operations into a downward trend. The 14-day SMA trend line remains conjoined with the 50-day SMA trend line at the value line. The bullish trend line drew beneath the SMAs, indicating the likable path price tends to regain its support afterward. The Stochastic Oscillators are in the oversold region, with the lines briefly crossed northbound against the range at 20. The crypto appears, striving to gain supports.
Can there still be more loss of momentum to the downside as the BCH/USD price flutters at $600?
More loss of momentums to the downside cannot overrule as the BCH/USD price flutters around the level of $600. However, the bullish trend line drawn beneath the SMAs has been able to locate some ideally psychological trading path for supports where downward force may not easily breach through. In the meantime, some pressures are potentially going to feature, favoring an upside move.
On the downside, after expected some upward pressures might have to get exhausted beneath or around the resistance line at $700, a convergence of price actions may surface around the value line. If that scenario plays out accordingly, depression will likely take place afterward. But, short position takers needed to be cautious of exerting sell orders while doing so.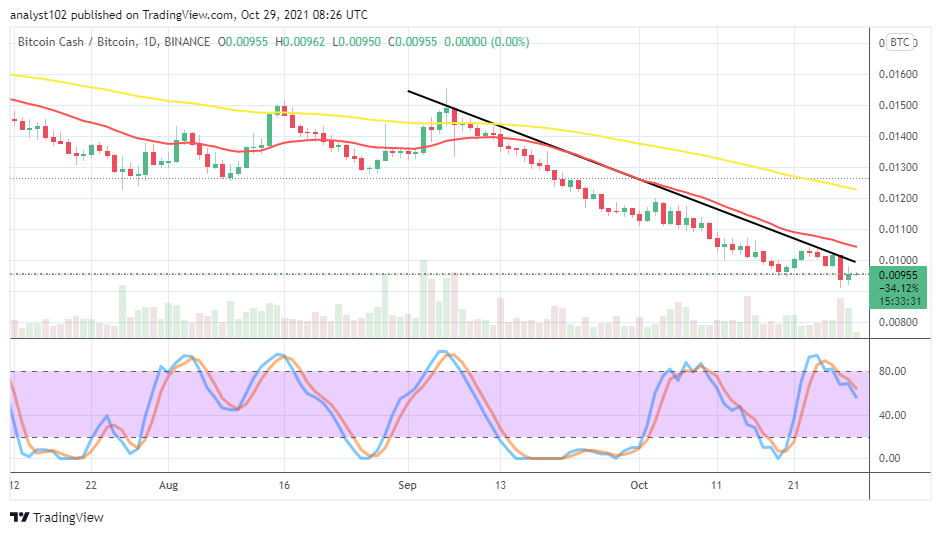
BCH/BTC Price Analysis
In comparison, the trending capacity of Bitcoin Cash as placed against Bitcoin incapacitated to push the market northward as price flutters around the bearish trend line. The 14-day SMA indicator is underneath the 50-day SMA indicator. The Stochastic Oscillators are with a low-active force slantingly bent southbound against the range line at 80. That indicates that the base crypto may still go under, trending with the flagship crypto.
Note: Cryptosignals.org is not a financial advisor. Do your research before investing your funds in any financial asset or presented product or event. We are not responsible for your investing results.
You can purchase crypto coins here. Buy Tokens