Quant Price Prediction: QNT/USD Hovers Around $146.71 as Price Faces the Upside
Don’t invest unless you’re prepared to lose all the money you invest. This is a high-risk investment and you are unlikely to be protected if something goes wrong. Take 2 minutes to learn more

Quant Price Prediction – February 16
The Quant price prediction shows that QNT could give a remarkable improvement if it retains the bullish movement above the moving averages.
QNT/USD Medium-term Trend: Ranging (1D Chart)
Key Levels:
Resistance levels: $175, $180, $185
Support levels: $120, $115, $110

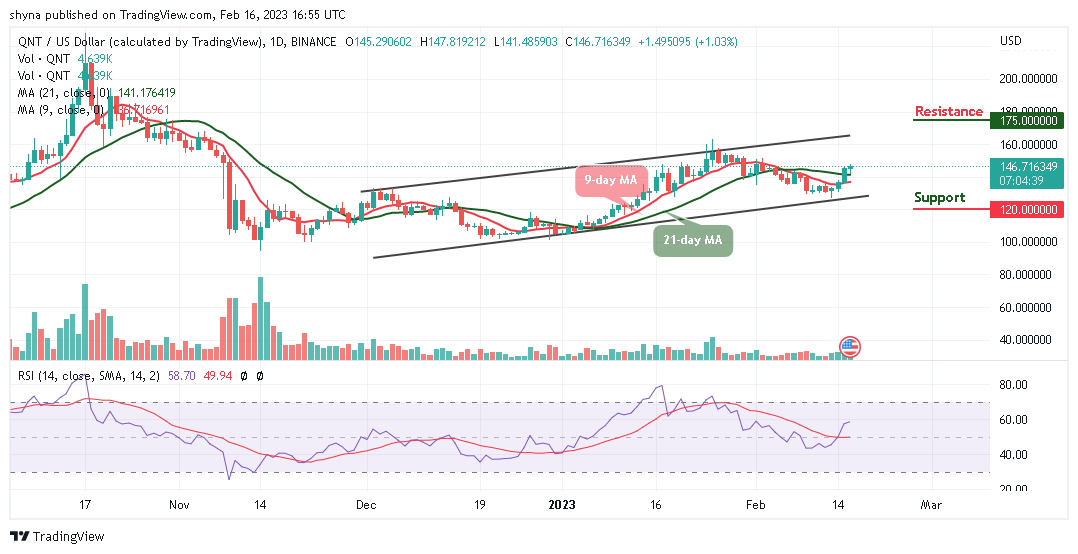
According to the daily chart, QNT/USD is preparing to move towards an upward formation after having a bearish session a few hours ago. However, the Quant price is moving toward the upper boundary of the channel as the signal line of the technical indicator Relative Strength Index (14) is moving to cross above the 60-level, which indicates that bullish movement may play out.
Quant Price Prediction: QNT Bulls Will Spike to the Upside
The Quant price is maintaining a bullish movement above the 9-day and 21-day moving averages to head to the upside. However, if the coin crosses above the upper boundary of the channel, the bulls would push the price toward the resistance levels of $175, $180, and $185. On the contrary, if QNT/USD drops below the lower boundary of the channel, the price could touch the support levels at $120, $115, and $110 respectively.
QNT/USD Medium-term Trend: Bearish (4H Chart)
QNT/USD is trading above the 9-day and 21-day moving averages as the technical indicator Relative Strength Index (14) moves into the overbought region which could introduce a solid bullish movement in the market. Meanwhile, a possible drop below the 9-day moving average could surface if the price head to the south, any further bearish movement can bring the coin to the critical support level of $135 and below.

However, if the bulls push the coin higher, the Quant price will cross above the upper boundary of the channel. Once this comes to focus, the price would hit the resistance level of $160 and above. Moreover, the trading volume is coming up slowly and will begin to climb higher if the technical indicator moves to the positive side.
Place winning Quant trades with us. Get QNT here


