Bitcoin Price Prediction: BTC/USDT Makes Its Way Back Toward $90K
Estimated Reading Time: 3 minutes
Don’t invest unless you’re prepared to lose all the money you invest. This is a high-risk investment and you are unlikely to be protected if something goes wrong. Take 2 minutes to learn more

Bitcoin Price Prediction (March 25):
Recently, the Bitcoin market has started to reclaim lost ground due to previous downward retracements. Interestingly, price action has remained resilient as it makes its way back upward. Although some technical indicators hint at a possible trend reversal shortly, let’s take a closer look at the market below.
BTC/USDT Long-Term Trend: Bearish (Daily Chart)
Key Price Levels:
Resistance: $90,000, $100,000, $105,000
Support: $85,000, $80,000, $75,000
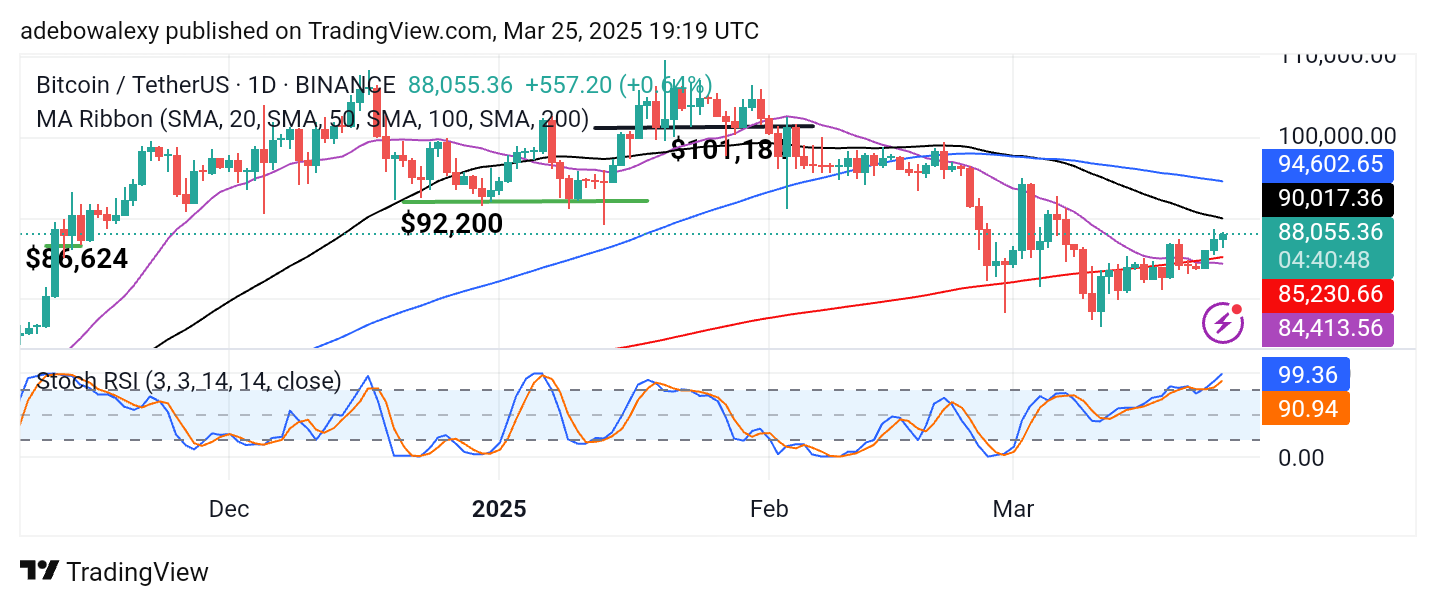
The most recent price candle on the Bitcoin daily chart has been bullish. As a result, the market has been edging higher. The last price candle now stands above the intersecting 20-day, 50-day, 100-day, and 200-day Moving Average (MA) lines. Likewise, the Stochastic Relative Strength Index (RSI) lines can be seen moving upward, even after reaching the overbought region, as an upward crossover has just occurred precisely at the 80 mark of the indicator.
Bitcoin Price Prediction: BTC/USDT Bulls Aim for the $90K Price Level
The BTC/USDT market has been recovering slightly from its previous price slump. As a result, price action is steadily rising toward the $90,000 price level. The last price candle on this daily chart is green and positioned further above the 20-day and 200-day MA lines. Consequently, price action is approaching the 50-day MA curve from below.
The Stochastic RSI lines are also maintaining their sharp upward trajectory. Despite the indicator suggesting an overbought condition, if upside momentum persists, price action may push further toward higher levels as the RSI lines hover near the 100 mark.
Bitcoin Price Prediction: BTC/USDT Buyers Strengthen Their Hold (4-Hour Chart)
The Bitcoin 4-hour chart reveals that bullish momentum may strengthen in the short term. Here, price action now stands above all the MA lines. Similarly to what is observed on the daily chart, the most recent price candles appear green.
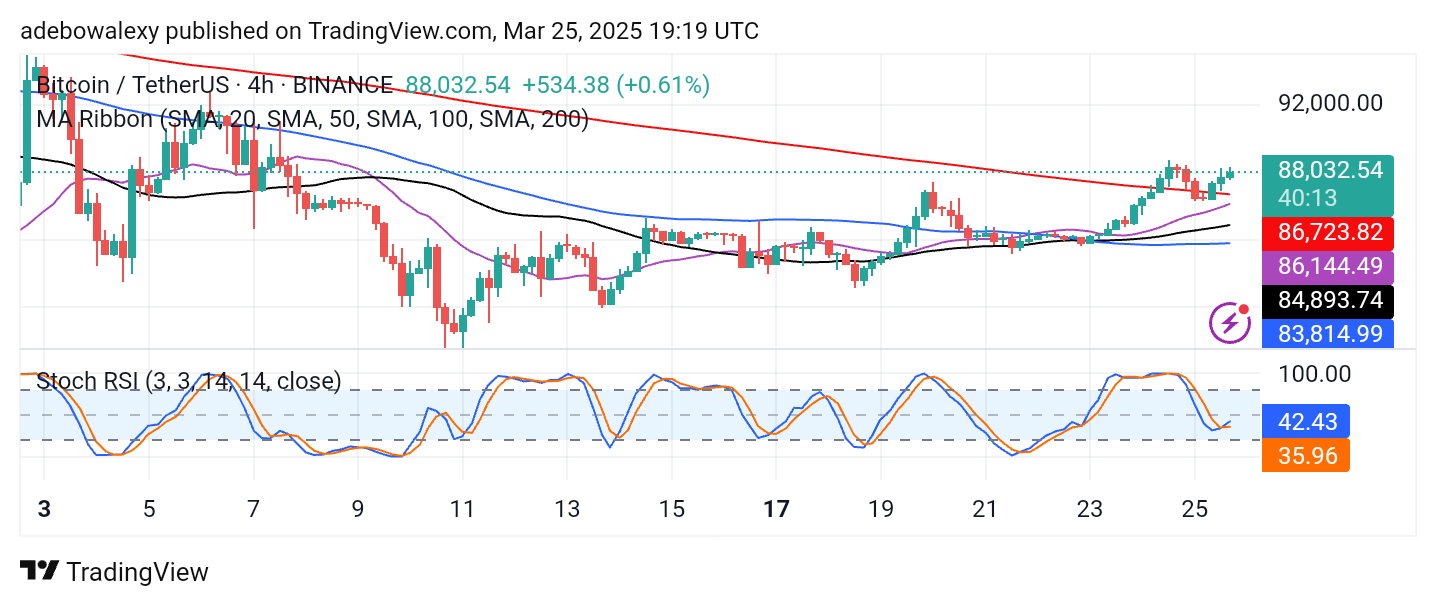
Meanwhile, the 20-day and 200-day MA lines are converging below the price action. At the same time, the Stochastic RSI indicator has just delivered a crossover below the 50 threshold level. Consequently, technical indicators seem to align in suggesting that prices may continue to edge higher. As a result, traders may target the $90,000 price level.