Litecoin Price Prediction: LTC/USDT Remains Under Pressure
Estimated Reading Time: 3 minutes
Don’t invest unless you’re prepared to lose all the money you invest. This is a high-risk investment and you are unlikely to be protected if something goes wrong. Take 2 minutes to learn more

Litecoin Price Prediction (March 25):
Recently, after price activity fell below critical levels, we can see that price action has remained below these levels. However, over time, it appears to be trending slightly upward. This gives some hope that downward forces may soon lose control entirely, allowing the market to proceed upward as buyers resume activity.
LTC/USDT Long-Term Trend: Bearish (Daily Chart)
Key Price Levels:
Resistance: $98.00, $100.00, $104.00
Support: $90.00, $86.00, $82.00
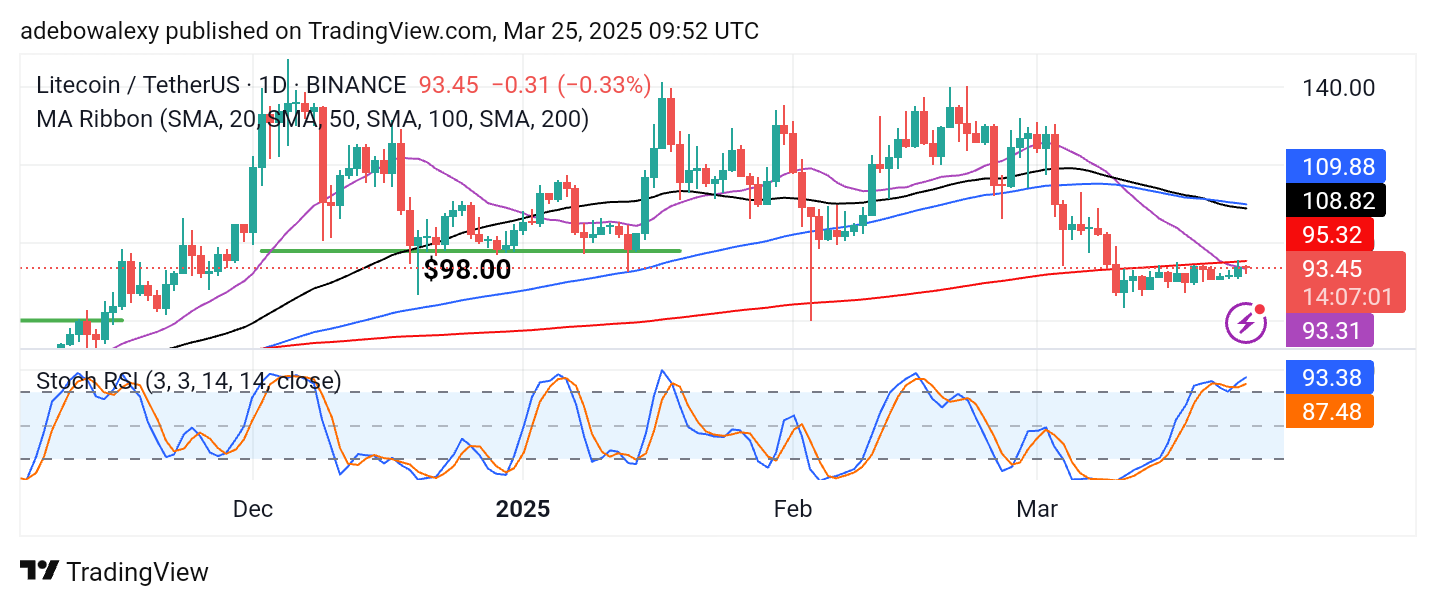
On the Litecoin daily chart, price activity has shown more green candles recently. However, trading activity remains confined below all the Moving Average (MA) lines on the chart. Additionally, the corresponding price candle for the ongoing session has appeared red. Meanwhile, the Stochastic Relative Strength Index (RSI) lines are already in the overbought region, above the 80 level, and maintain an upward trajectory following a crossover.
Litecoin Price Prediction: LTC/USDT Buyers Seem Unwilling
By carefully observing price behavior in the Litecoin daily market, it appears that buyers are exercising caution. As a result, there is insufficient buying pressure to push the market past the 20-day MA line. This is evident as the last price candle is red after price action tested the resistance formed by the 20-day MA.
Additionally, the Stochastic RSI indicator is already in the overbought region, as its lines remain near the 100 threshold. Although the indicator still projects upward, a crossover may occur shortly, potentially causing prices to decline further. However, changing market fundamentals could prevent this, and traders will be closely monitoring the situation.
Litecoin Price Prediction: Is LTC/USDT Eyeing the $96 Mark? (4-Hour Chart)
Examining the Litecoin market on the 4-hour chart, we can see that the most recent price candle stands above all the MA lines. What’s particularly interesting is that the MA lines appear to be converging, while the last price candle is noticeably larger than the previous one.
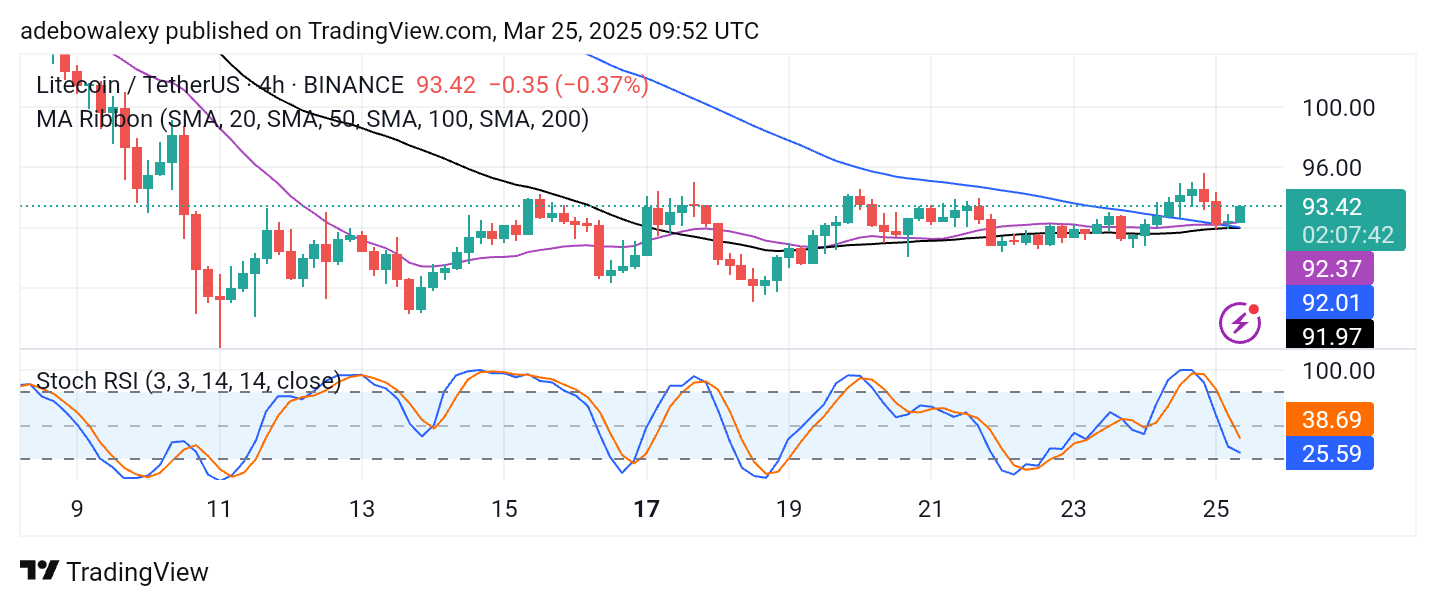
Meanwhile, the Stochastic RSI lines are still generally oriented toward the overbought region, although a slight deflection can be seen on the lead line, suggesting a potential price shift. Based on the available indicators, traders may continue aiming for short-term targets below $100.