Dogecoin Price Prediction: DOGE/USDT Prepares to Test $0.1800
Estimated Reading Time: 2 minutes
Don’t invest unless you’re prepared to lose all the money you invest. This is a high-risk investment and you are unlikely to be protected if something goes wrong. Take 2 minutes to learn more

Dogecoin Price Prediction (March 24):
The Dogecoin market is currently managing to secure minimal gains. This trend appears to be correlated with Bitcoin, as the leading cryptocurrency recently broke through the $85,000 threshold. However, Dogecoin seems to be gaining only marginally at the moment. Let’s see if it can build momentum for a more significant move later.
DOGE/USDT Long-Term Trend: Bearish (Daily Chart)
Key Price Levels:
Resistance: $0.2000, $0.2500, $0.3000
Support: $0.1700, $0.1500, $0.1200
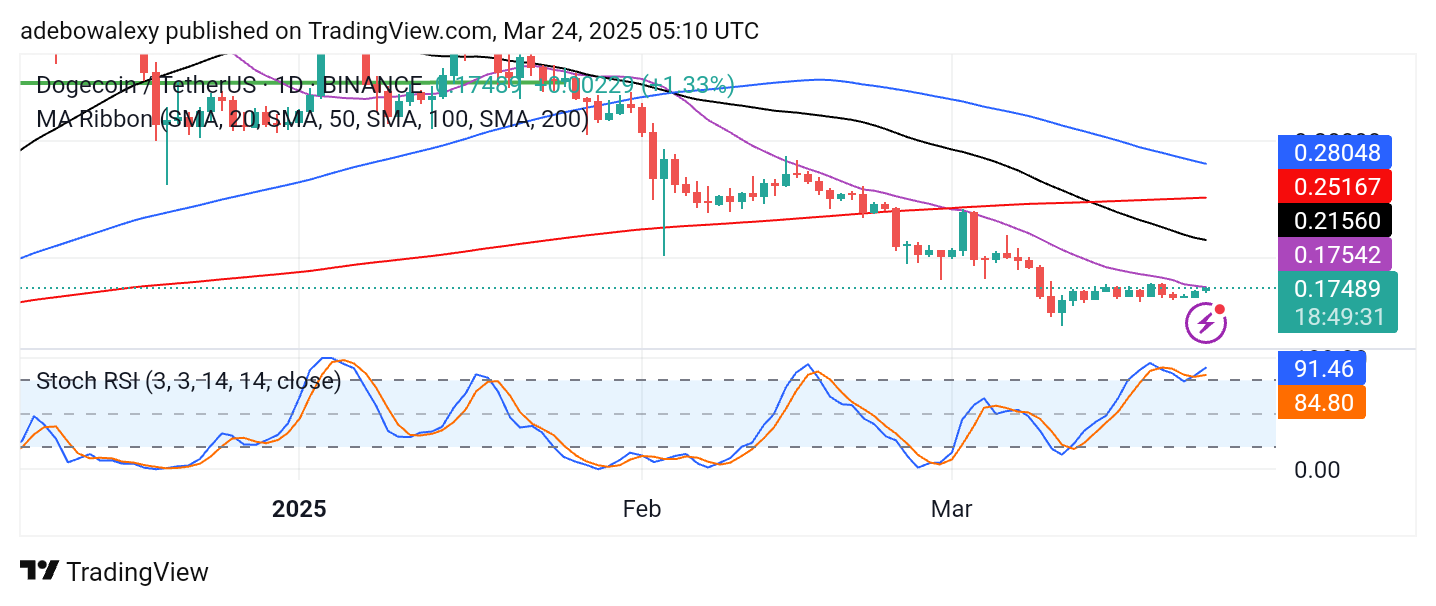
Price action remains below the 20-day Moving Average (MA) line, implying it is still positioned beneath all the MA lines on the chart. However, the most recent price action on the chart is bullish, with the price currently testing the 20-day MA. Additionally, the Stochastic Relative Strength Index (RSI) lines have recently formed an upward crossover in the overbought region, suggesting a potential continuation of upward momentum.
Dogecoin Price Prediction: DOGE/USDT Is Pushing Limits
Price activity in the Dogecoin daily market is gaining bullish momentum, albeit on a minimal scale. Since the previous session, buyers have been in control. The corresponding price candle for the ongoing session continues to hover around the 20-day MA.
Furthermore, the Stochastic RSI indicator lines have formed an upward crossover in the overbought region. These lines are trending upward, supporting the notion that buyers are currently influencing the price trend.
Dogecoin Price Prediction: DOGE/USDT Ascends Toward the $0.1800 Threshold (4-Hour Chart)
In the DOGE/USDT 4-hour market, price action continues to ascend toward higher levels. The price has moved past most of the MA lines on the chart.
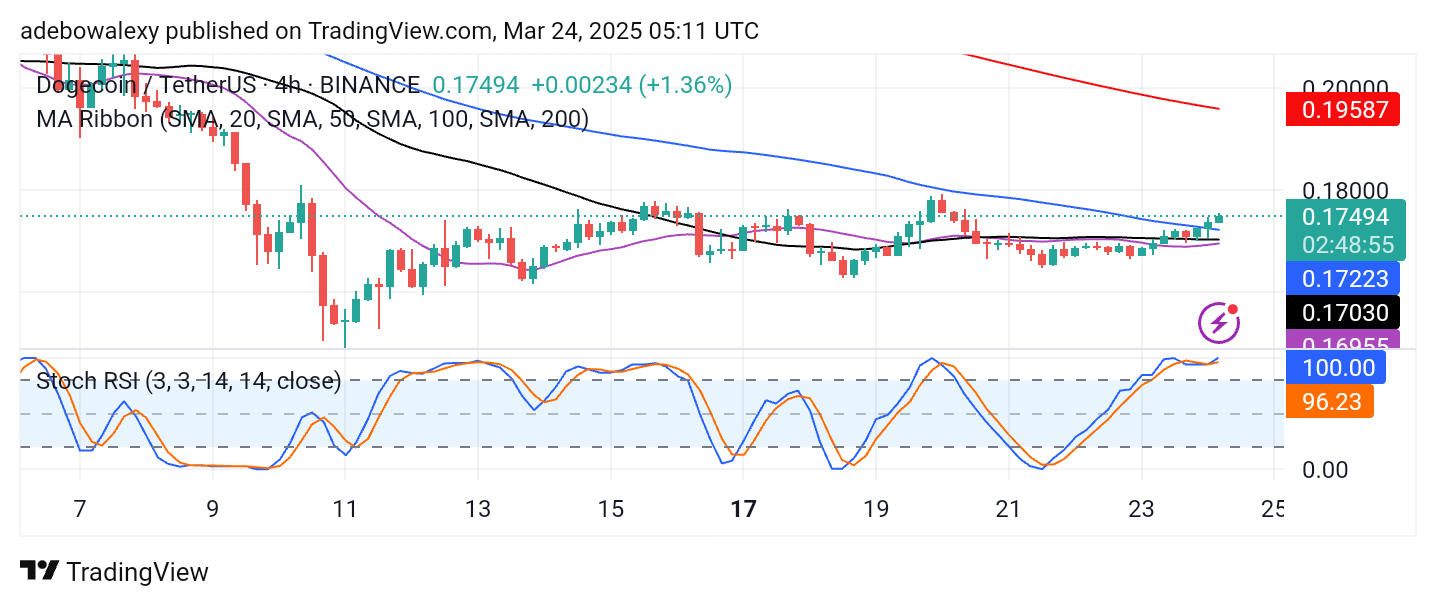
Meanwhile, the Stochastic RSI lines are nearing the terminal level, with the lead line already testing the 100 thresholds. However, given that the crossover was recently completed, it appears that the RSI lines may trend sideways around the 100 mark. This movement could allow price action to reach at least the $0.1800 level.