Cardano (ADA) Fluctuates Between $2.00 and $2.40, Faces Rejection at $2.40
Estimated Reading Time: 2 minutes
Don’t invest unless you’re prepared to lose all the money you invest. This is a high-risk investment and you are unlikely to be protected if something goes wrong. Take 2 minutes to learn more

Cardano (ADA) Long-Term Analysis: Bearish
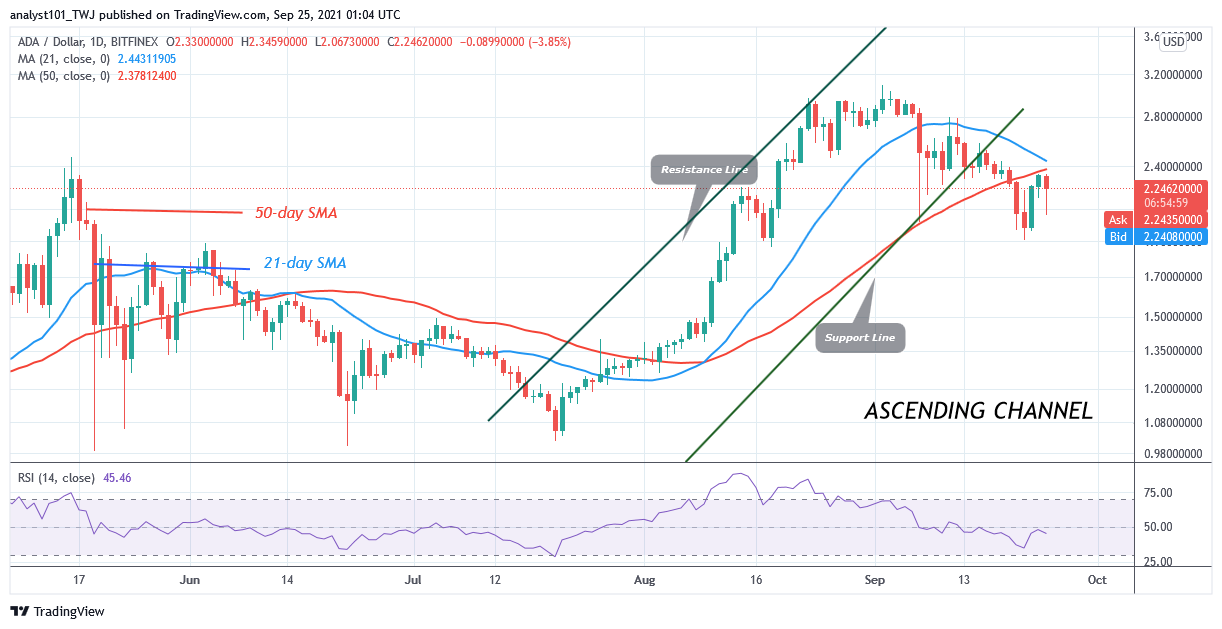
Cardano’s (ADA) price has broken below the moving averages. The implication is that the market will decline as long as price bars are below the moving averages. Today, buyers are attempting to push ADA price above the $2.40 resistance. If buyers are successful and the bullish momentum is sustained, Cardano will resume upside momentum. Presently, the market is facing rejection at the $2.40 resistance. There is a likelihood that ADA price to revisit the previous low at $2.02. Nevertheless, if the bears break below the previous low, ADA will fall into a deeper correction.
Cardano (ADA) Indicator Analysis
Cardano is at level 44 of the Relative Strength Index period 14. It indicates that the crypto is in the downtrend zone and capable of falling on the downside. The 21-day and 50-day SMA are sloping downward indicating the downtrend. The altcoin is below the 40% range of daily stochastic. The market is in a bearish momentum.
Technical indicators:
Major supply zones: $2.0, $2.20, $2.40
Major demand zones: $1.40, $1.20, $1.00
What Is the Next Direction for Cardano (ADA)?
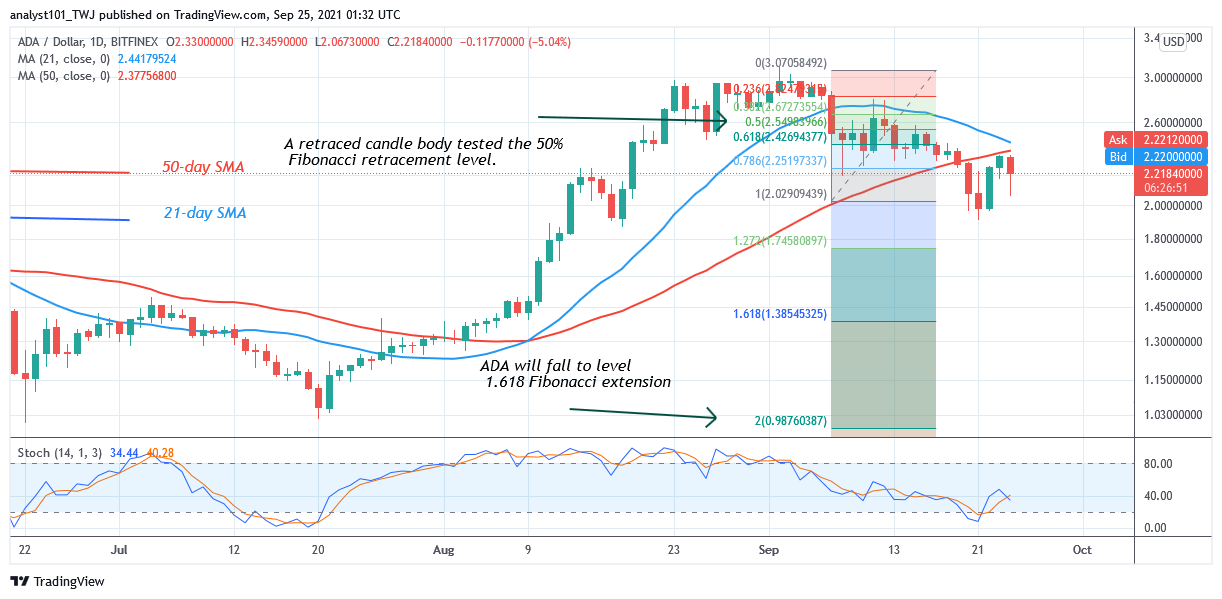
On the daily chart, the crypto fell to the previous low at $2.02 and resume consolidation between $2.02 and $2.40. Meanwhile, on September 7 downtrend; a retraced candle body tested the 50% Fibonacci retracement level. The retracement indicates that ADA is likely to fall to level 2.0 Fibonacci extension or level $0.98.
You can purchase crypto coins here. Buy Token
Note: Cryptosignals.org is not a financial advisor. Do your research before investing your funds in any financial asset or presented product or event. We are not responsible for your investing results