COMP/USD Initiates Strong Rebound As Buyers Take Charge
Estimated Reading Time: 3 minutes
Don’t invest unless you’re prepared to lose all the money you invest. This is a high-risk investment and you are unlikely to be protected if something goes wrong. Take 2 minutes to learn more

Compound Price Analysis – COMPUSD Bulls are on the Run
The Compound (COMP/USD) market shows a robust rebound after finding strong support at lower levels. The asset is exhibiting significant buying momentum, with bulls aggressively pushing the price upwards and potentially reversing the recent corrective trend.
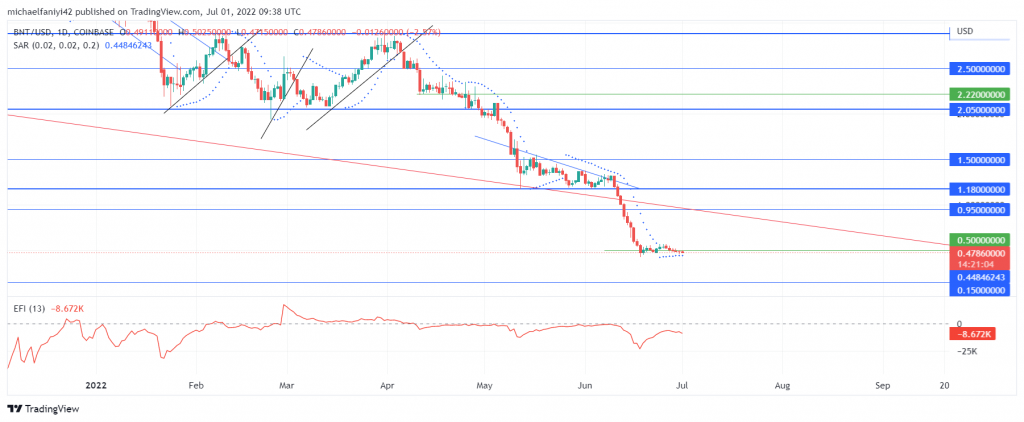
Compound Key Levels
Support Levels: $38.80 $36.90, $28.30
Resistance Levels: $50.30, $56.90

The daily chart for COMP/USD illustrates that after a significant rally earlier in the year, the asset entered a prolonged corrective phase, pushing the price towards the $38.87 support level. Recently, a strong bullish candle has formed, indicating a significant bounce from this support. Currently, COMP is trading at $48.16, showing a substantial increase of +10.04% .
The long-term trend suggests that while the correction has been deep, buyers are now showing strong interest at these lower valuations, attempting to reclaim prior resistance levels. The Parabolic SAR dots have recently flipped below the price, further confirming the shift towards an uptrend.
COMPUSD is experiencing a significant resurgence in buying interest. After touching a low of $38.80, the price has seen a strong bounce, confirming demand at this support zone. The immediate cross focus for the market is whether this upward momentum can be sustained to challenge the critical resistance at $50.36 and potentially $56.92. The sharp increase in price suggests that bulls are currently in control and are actively pushing to regain lost ground.
COMP is experiencing a strong rebound, with bulls aiming for higher resistance levels.

Market Expectation
The 4-hour shows COMP/USD trading at $48.13, with a substantial increase of +10.84%. This timeframe clearly depicts the sharp, almost vertical, rise in price from the $38.87 support level. The candlesticks are large and predominantly green, indicating aggressive buying pressure and a strong shift in market sentiment. The Parabolic SAR dots have been consistently below the price, reinforcing the clear short-term uptrend.
You can purchase Lucky Block here. Buy LBLOCK
Note: Cryptosignals.org is not a financial advisor. Do your research before investing your funds in any financial asset or presented product or event. We are not responsible for your investing result.