Compound (COMPUSD) Respects Resistance Trendline
Estimated Reading Time: 2 minutes
Don’t invest unless you’re prepared to lose all the money you invest. This is a high-risk investment and you are unlikely to be protected if something goes wrong. Take 2 minutes to learn more

Price Analysis – Compound Faces Trendline Resistance
Compound price continues to trade under a major resistance trendline on the daily chart. Each test of the trendline has resulted in the formation of a swing high, revealing the sensitivity of the trendline as the price dips further.
COMPUSD Key Levels
Demand Levels: $29.880, $20.000, $10.000
Supply Levels: $38.340, $48.400, $60.780
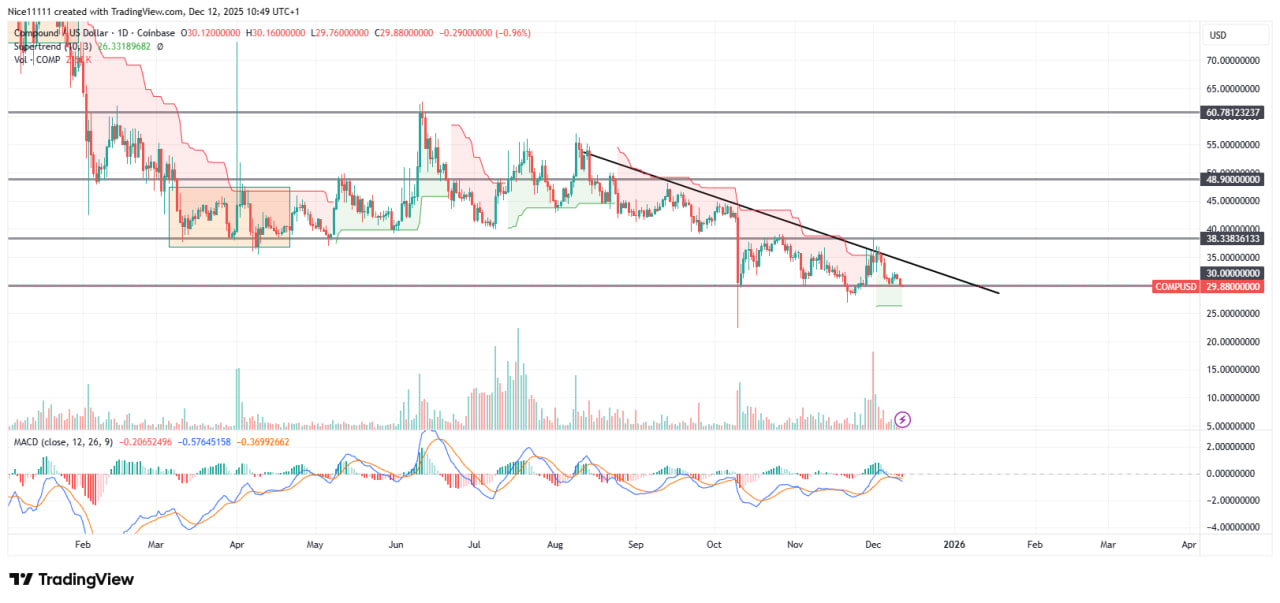 Price action has formed consistent lower highs since September, which have been used to anchor the trendline. The resultant effect was obvious—a reversal in the upward move that sent the price to $29.410.
The MACD (Moving Averages Convergence and Divergence) line and signal line have also failed to cross above the zero mark on the indicator panel, showing persistent bearish dominance.
The major level of $38.400 served as support in late Q1 and early Q2 when the market was ranging on the daily chart. After the break of this key level, which previously acted as support, the same level now plays the role of strong resistance in Q4.
 Market Expectation
 Market Expectation
Following the test of the confluence region consisting of the bearish trendline and the key level of $38.340, the price is making a third attempt to break below the key level of $29.410. The continuous retest could weaken the zone and enforce a breakout.
You can purchase Lucky Block here. Buy LBLOCK
Note: Cryptosignals.org is not a financial advisor. Do your research before investing your funds in any financial asset or presented product or event. We are not responsible for your investing results.