Compound (COMPUSD) Slides Down Beyond Its All-Time Low
Estimated Reading Time: 2 minutes
Don’t invest unless you’re prepared to lose all the money you invest. This is a high-risk investment and you are unlikely to be protected if something goes wrong. Take 2 minutes to learn more

Free Crypto Signals Channel
COMPUSD Analysis – The Market Slides Down Beyond Its Lowest Level at $60
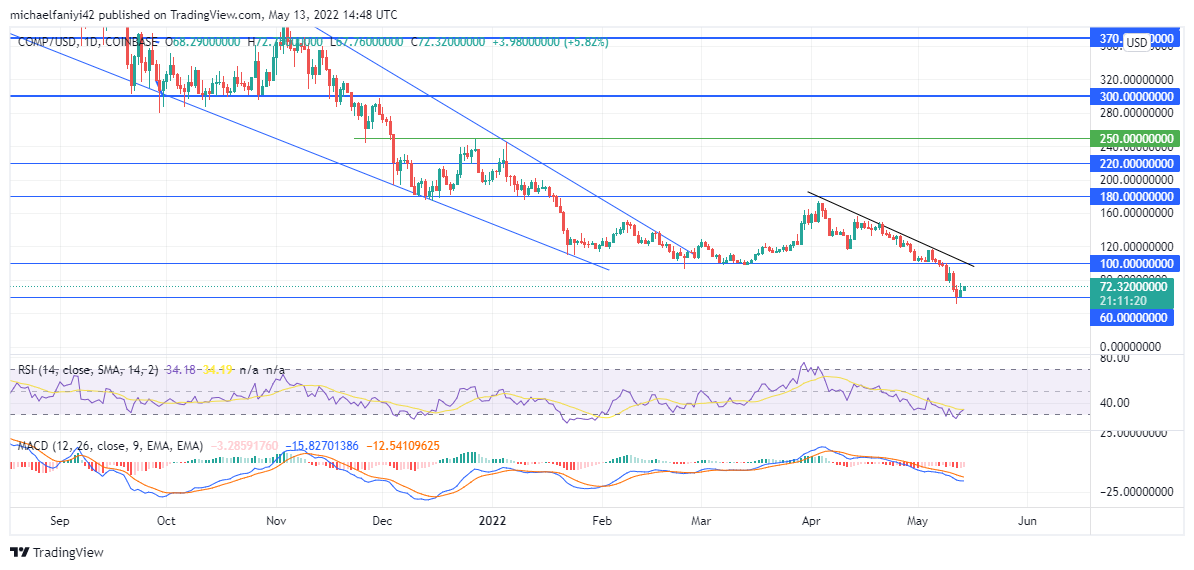
COMPUSD slides down beyond its all-time low price level at $60. Shortly before the massive drawdown, the price had touched down at $100 and was expected to push immediately back up to its confinement resistance level. It didn’t happen immediately, and when it happened, it led to rejection that made the price slide down below the $100 support level.
COMPUSD Key Levels
Resistance Levels: $180, $220
Support Levels: $60, $100
The market can be described as having been bullish right from the middle of last year. This is seen as the coin kept defying different significant levels to plunge downwards. It was only when the crypto slid down to $100 that there was stability for COMPUSD. Even at that, bearish pressure persisted. Not long after, Compound falls below $100, setting a new all-time low of $60.
The (Relative Strength Index) can be seen as portraying the market’s trend, in which its line took a dive from an overbought region to an oversold region. The MACD (Moving Average Convergence Divergence) is also in compliance with the RSI. Its line dived a positive value steeply below the zero level with bearish histogram bars accompanying. This just emphasizes the strength of the sellers in the market.

Market Expectations
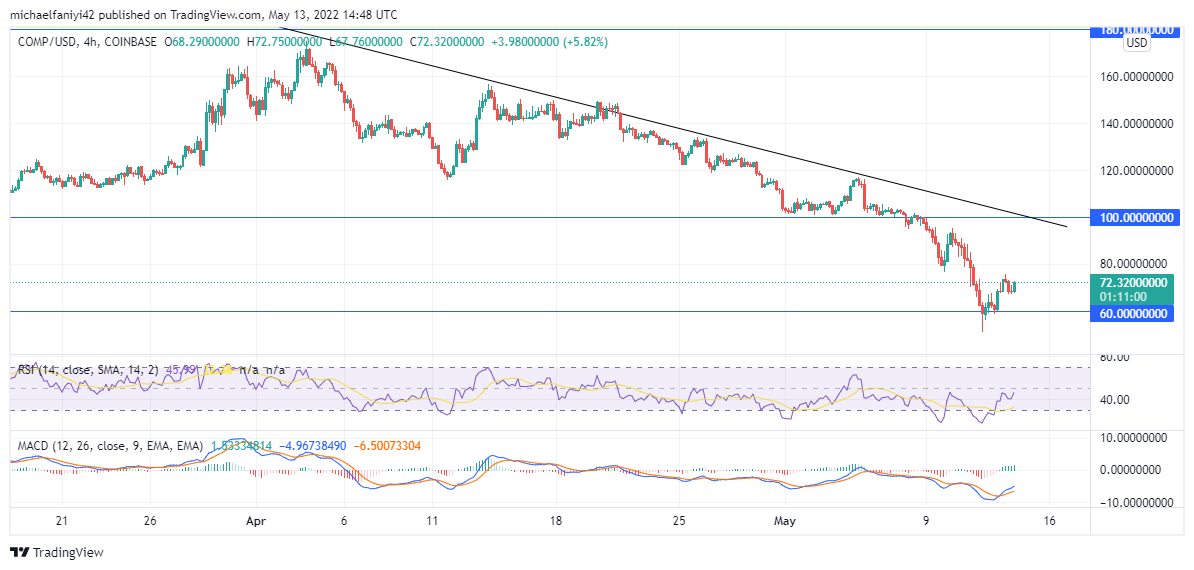
The 4-hour time frame shows the price could be set for immediate recovery from a very depressed position. After dropping slightly below $60, the market has posted a bullish reversal candlestick and is rising above the $60 level. The MACD, which seems to have plunged to its deepest level yet, has its lines now crossing upward. The same can be said for the RSI, whose line is now approaching the middle line. If the price recovers above $100, it will then aim for $180.
How To Buy Lucky Block
Note: Cryptosignals.org is not a financial advisor. Do your research before investing your funds in any financial asset or presented product or event. We are not responsible for your investing results.

