DeFi Coin Price Prediction: DEFC/USD Falls to $0.09; It’s Time to Buy
Estimated Reading Time: 3 minutes
Don’t invest unless you’re prepared to lose all the money you invest. This is a high-risk investment and you are unlikely to be protected if something goes wrong. Take 2 minutes to learn more

Free Crypto Signals Channel
The DeFi Coin price prediction reveals that DEFC drops to touch the daily low of $0.09 as the price dips for new buyers to surface.
DEFC/USD Medium-term Trend: Bearish (4H Chart)
Key Levels:
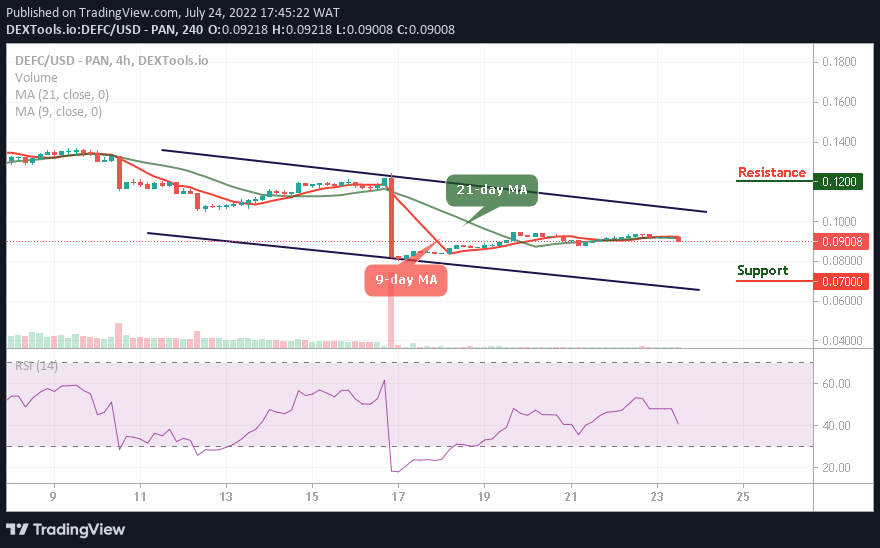
Resistance levels: $0.12, $0.13, $0.14
Support levels: $0.07, $0.05, $0.03
DEFC/USD is at the time of writing trading at $0.09 crossing below the 9-day and 21-day moving averages. According to the chart, sellers are pushing the coin towards the south as this could allow the new buyers to step into the market while the existing buyers are expected to buy the dips.
DeFi Coin Price Prediction: DEFC Price Retreats to Move Higher
Looking at the 4-hour chart, the DeFi Coin price is now cheap for more buyers to come into the market. However, the coin will drop more as the technical indicator Relative Strength Index (14) reveals, but the market will expect the existing buyers to buy the dips, any further supports could be located at $0.07, $0.05, and $0.03.
Moreover, should the buyers hold the current support of $0.09 and push the coin higher; the bulls can expect immediate resistance to be located at $0.11. Any further bullish movement above the upper boundary of the channel will hit the resistance level of $0.12, $0.13, and $0.15 respectively.
DEFC/USD Medium-term Trend: Ranging (2H Chart)
On the 2-hour chart, the DeFi Coin price remains below the 9-day and 21-day moving averages, but this could allow new buyers to enter the market. Similarly, the existing buyers are also expected to buy the dip as the market gathers momentum to begin another bullish movement.
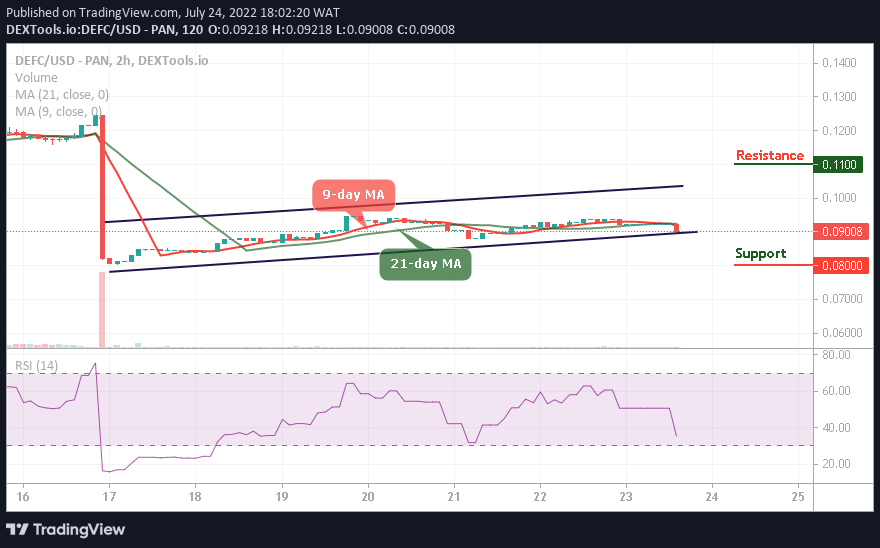
From above, if the buyers push the price above the moving averages; higher resistance could be found at $0.11 and above. Moreover, should the coin retreat and slide below the lower boundary of the channel, another support may come at $0.08 and below, while the Relative Strength Index (14) slides below the 40-level.
You can purchase DeFi Coin here. Buy DEFC