DeFi Coin Price Prediction: DEFC/USD Ready to Break Above $0.15 Level
Estimated Reading Time: 3 minutes
Don’t invest unless you’re prepared to lose all the money you invest. This is a high-risk investment and you are unlikely to be protected if something goes wrong. Take 2 minutes to learn more

Free Crypto Signals Channel
The DeFi Coin price prediction shows that DEFC heads to the north, if the bulls increase their momentum, the price would shoot higher.
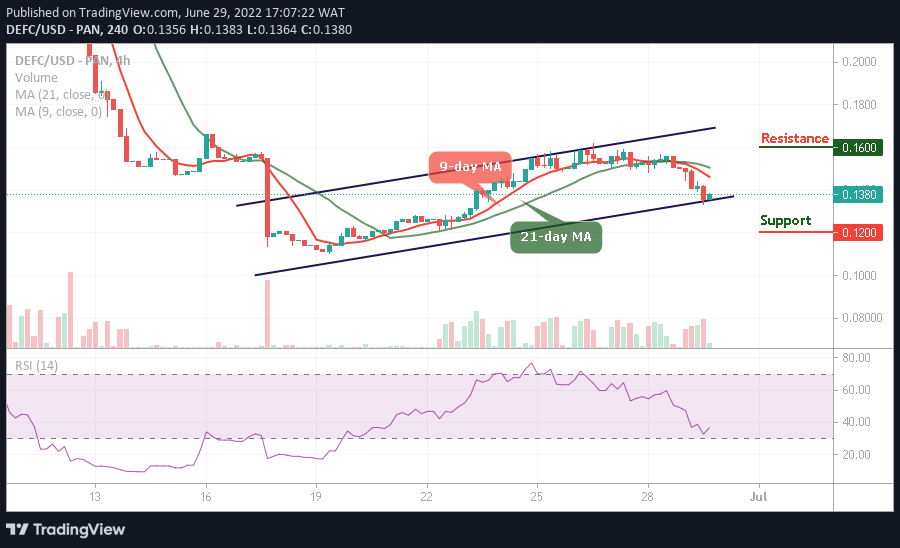
DEFC/USD Long-term Trend: Ranging (4H Chart)
Key Levels:
Resistance levels: $0.16, $0.18, $0.20
Support levels: $0.12, $0.10, $0.08
DEFC/USD is ready for the upside as the coin prepares for a recovery towards the 9-day and 21-day moving averages. However, if the bulls increase their momentum and penetrate the resistance level at $0.15, then, the price would shoot higher crossing above the moving averages.
DeFi Coin Price Prediction: DEFC Gets Ready for The Upside
Looking at the 4-hour chart, if the DeFi Coin price increases volume coupled with a bullish regroup, it will begin to correct gain significantly on the upside. However, on the contrary, the bears could become severe with more losses for the new buyers to enter as the next support levels could be located at $0.12, $0.10, and $0.08 respectively.
Nevertheless, the DeFi Coin price will begin to move to the upside if the coin crosses above the moving averages which could hit the potential resistance levels of $0.12, $0.10, and $0.08. The technical indicator Relative Strength index (14) is moving to cross above 40-level, suggesting bullish movement for the coin.
DEFC/USD Medium-term Trend: Ranging (2H Chart)
The DeFi Coin is trading below the 9-day and 21-day moving averages as revealed in the chart, but the coin is getting ready for the upward movement. Therefore, should the price break above the 9-day moving average, the market may experience an upward trend which could touch the resistance level at $0.15 and above.
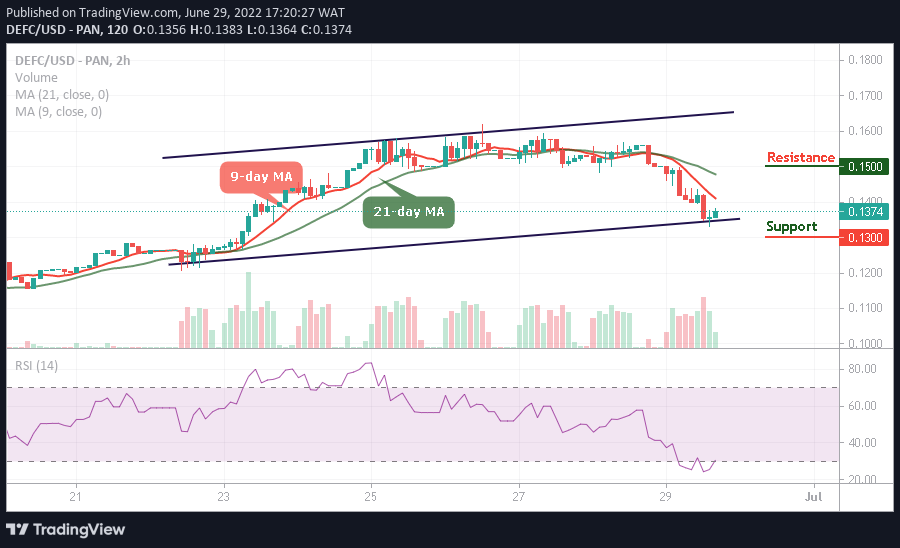
Meanwhile, DEFC/USD is likely to retreat a little bit, if the coin breaks below the lower boundary of the channel; it may hit the support at $0.13 and below. However, the technical indicator Relative Strength Index (14) prepares to leave the oversold region, suggesting incoming bullish signals.
You can purchase DeFi Coin here. Buy DEFC