DeFi Coin Price Prediction: DEFC/USD Resumes Uptrend as Price Revisits $0.11 Level
Estimated Reading Time: 2 minutes
Don’t invest unless you’re prepared to lose all the money you invest. This is a high-risk investment and you are unlikely to be protected if something goes wrong. Take 2 minutes to learn more

Free Crypto Signals Channel
The DeFi Coin price prediction keeps showing a remarkable improvement as the coin begins to follow the bullish movement.
DEFC/USD Medium-term Trend: Bullish (4H Chart)
Key Levels:
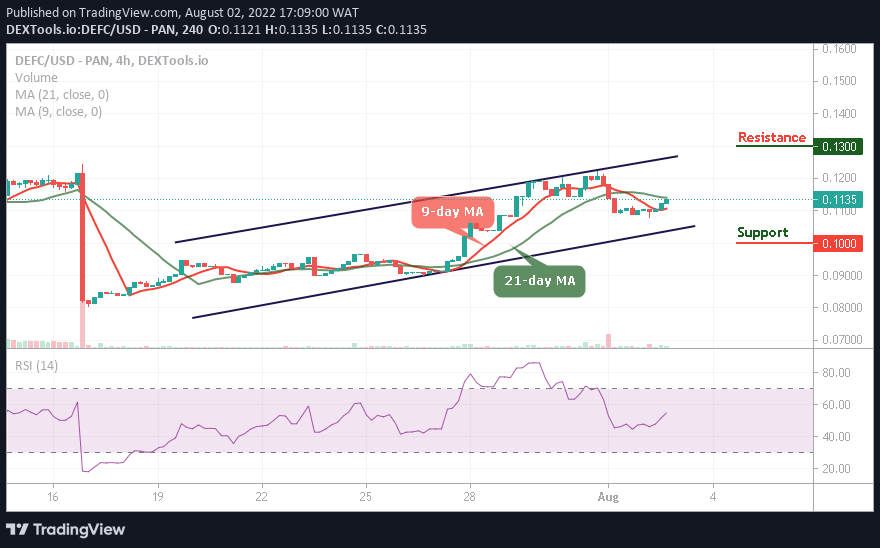
Resistance levels: $0.13, $0.14, $0.15
Support levels: $0.10, $0.09, $0.08
DEFC/USD is moving towards an upward formation as the coin moves to cross above the 21-day moving average. The DEFC price is currently trading at $0.113 as the signal line of the technical indicator Relative Strength Index (14) faces the 60-level with a bullish crossover.
DeFi Coin Price Prediction: DEFC Bulls Will Reclaim More Upsides
The DeFi Coin price is currently above the 9-day moving average, the coin is going to cross above the 9-day moving average to confirm the bullish movement. However, if the coin maintains the bullish trend, the price could hit the resistance levels at $0.13, $0.14, and $0.15 respectively. On the other hand, if DEFC/USD drops below the lower boundary of the channel, the DEFC price could touch the support levels at $0.10, $0.09, and $0.08.
DEFC/USD Medium-term Trend: Bullish (2H Chart)
DEFC/USD is trading above the 9-day and 21-day moving averages as the technical indicator Relative Strength Index (14) moves to cross above the 60-level which will increase the bullish movement. However, a possible drop below the lower boundary of the channel could play out if the price head to the south, any further bearish movement may bring the coin to the critical support level of $0.105 and below.
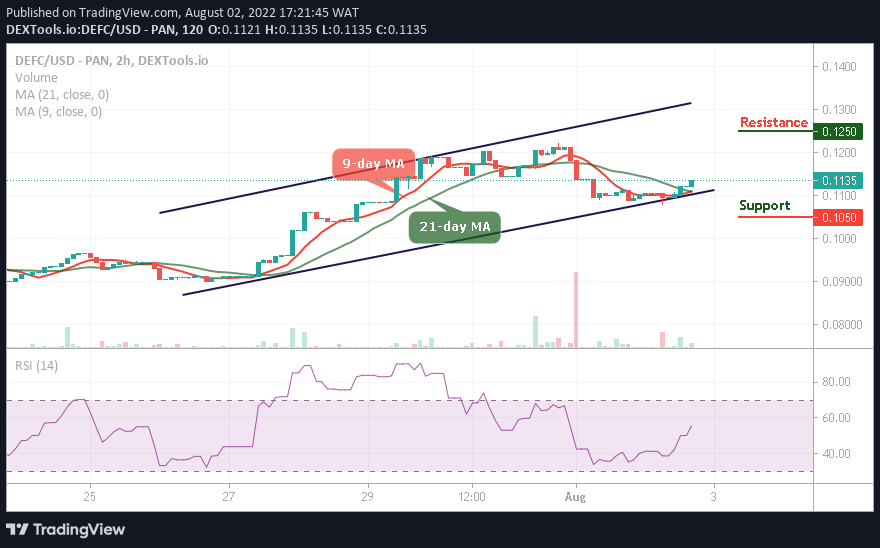
Nevertheless, as the bulls push the coin higher, the DEFC price will head towards the upper boundary of the channel. Once this comes to focus, the price would hit the resistance level of $0.125 and above. More so, the trading volume is coming up slowly and will begin to climb higher if the technical indicator moves to the positive side.
You can purchase DeFi Coin here. Buy DEFC