DeFi Coin Price Prediction: DEFC/USD Sets to Cross Above the Channel
Estimated Reading Time: 3 minutes
Don’t invest unless you’re prepared to lose all the money you invest. This is a high-risk investment and you are unlikely to be protected if something goes wrong. Take 2 minutes to learn more

Free Crypto Signals Channel
The DeFi Coin price prediction shows that DEFC is moving to the upside as the coin hovers around the $0.32 level.
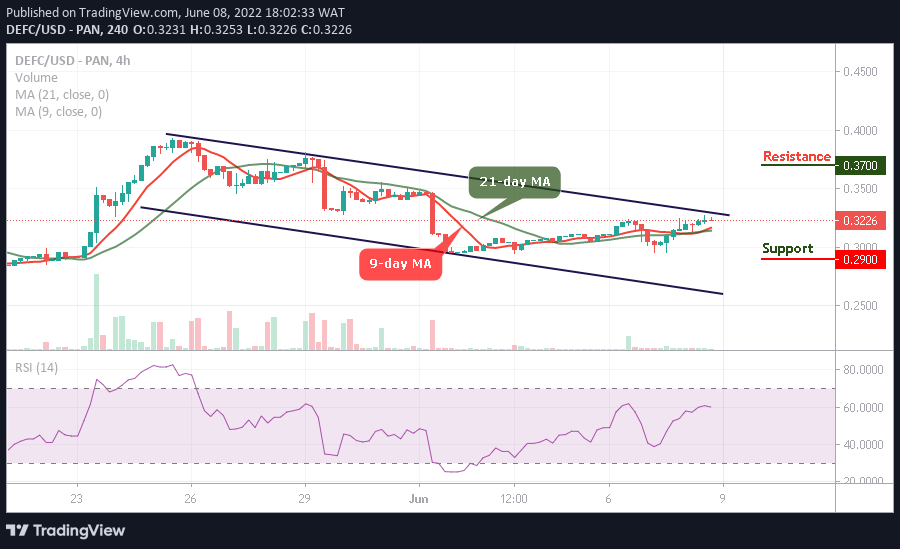
DEFC/USD Long-term Trend: Ranging (4H Chart)
Key Levels:
Resistance levels: $0.37, $0.38, $0.39
Support levels: $0.29, $0.27, $0.25
DEFC/USD could hit the $0.35 resistance level in the next positive movement as the difficult time seems to be over for the coin. However, the DEFC price is currently trading at $0.32, although the coin is attempting to cross above the upper boundary of the channel, it could probably touch the resistance level of $0.35 for it to move higher.
DeFi Coin Price Prediction: DEFC Price Ready for the Upward Movement
The DEFC price is seen moving above the 9-day moving average. A break above the upper boundary of the channel could encourage more buyers to increase their entries, and they could eventually push the coin to hit the resistance levels of $0.37, $0.39, and $0.41. On the downside, if the price breaks below the 9-day and 21-day moving averages, the sell-off could gain traction with the next focus toward the lower boundary of the channel.
Moreover, if the support level of $0.30 is broken, the downside pressure may increase while the next supports may be created around $0.29, $0.27, and $0.25 respectively as the buyers should get ready to buy the dip. However, the technical indicator Relative Strength Index (14) will remain above the 60-level, to give additional bullish signals.
DEFC/USD Medium-term Trend: Ranging (2H Chart)
The DeFi Coin is moving above the 9-day and 21-day moving averages to confirm the bullish movement within the channel. However, a close above the upper boundary of the channel will encourage the bulls to extend the rally towards the resistance level of $0.35 and above.
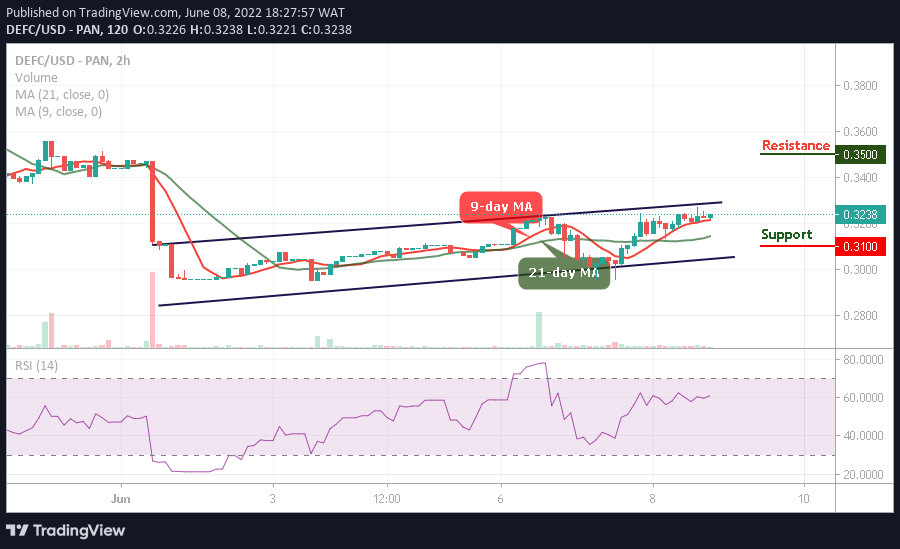
On other hand, a drop below the 9-day and 21-day moving averages could reverse the DEFC price, and a further bearish movement could take the coin to the support level of $0.31 and below. Meanwhile, there is a possibility that the DeFi coin will continue the upward movement as the technical indicator Relative Strength Index (14) moves to cross above 50-level with the signal line pointing to the north.
You can purchase DeFi Coin here. Buy DEFC