Dogecoin (DOGE/USD) Price Moves, Featuring Lower Lows
Estimated Reading Time: 3 minutes
Don’t invest unless you’re prepared to lose all the money you invest. This is a high-risk investment and you are unlikely to be protected if something goes wrong. Take 2 minutes to learn more

Free Crypto Signals Channel
Dogecoin Price Prediction – August 29
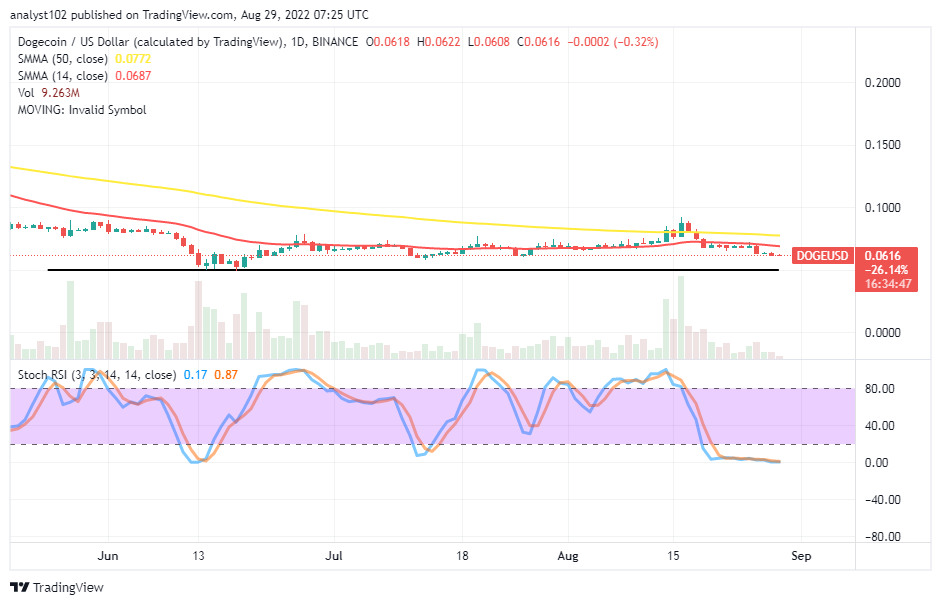
Business operations in the DOGE/USD market have been under falling pressures as the crypto economy-economic price moves, featuring lower lows. As of the writing, the price is trading around $0.0616 at a minute average percentage rate of 0.32.
DOGE/USD Market
Key Levels:
Resistance levels: $0.085, $0.095, $0.105
Support levels: $0.05, $0.04, $0.03
DOGE/USD – Daily Chart
The daily chart showcases the crypto market price moves, featuring lower lows below the sell signal sides of the SMAs. The 50-day SMA indicator is at $0.0772 above the $0.0687 value line of the 14-day SMA indicator. The horizontal line drew at the $0.05 support level. The Stochastic Oscillators are in the oversold region in a conjoining outlook, signifying that the market consolidates downward to the downside.
Can the DOGE/USD market decline further as price features lower lows?
The declining force in the DOGE/USD market operation, furthermore at its current trading capacity, may not build sustainably to the downside as the crypto’s price moves, featuring lower lows. Momentarily, selling activities may hold closely toward or around the $0.05 support level, where a horizontal line has been to mark the critical baseline against seeing reliable downs. Therefore, it is a good time for investors to start adding to their portfolios. Like wisely, long-term-position placers can add to their previous buying positions at this time.
The downside of the DOGE/USD market technical analytics outlook suggests that selling activities have to begin to be suspended for a while as there has an overly oversold reading condition borne out by the Stochastic Oscillators. The trading situation yet portends that the market is under depression. But it appears not technically ideal to ride alongside the south side because it exposes to a rebound in no time.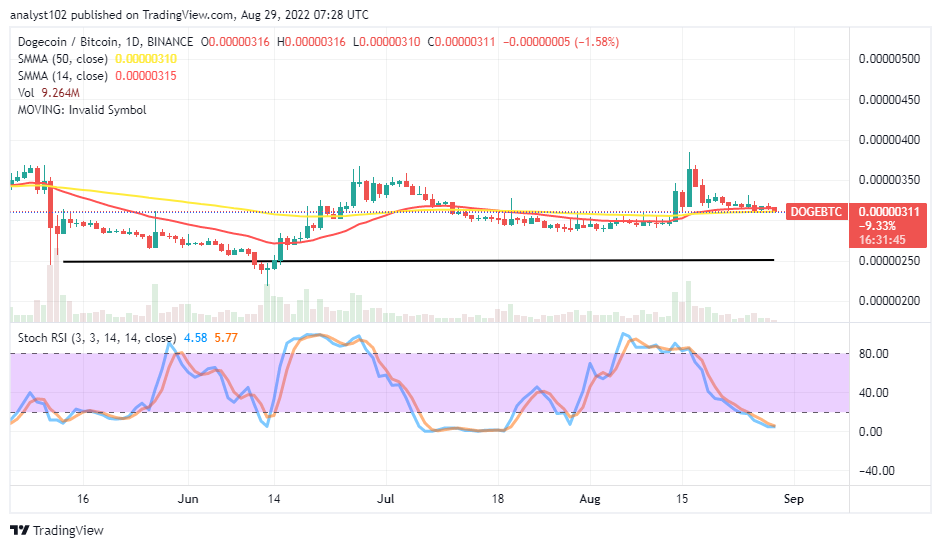
DOGE/BTC Price Analysis
The price analysis chart reveals that Dogecoin still somewhat holds at a higher-low trading spot around the conjoined positions of the SMA trend lines. The cryptocurrency pair price moves, featuring higher lows feebly past the SMAs. The 14-day SMA indicator has joined with the 50-day SMA indicator. The Stochastic Oscillators have penetrated the oversold region, keeping 5.77 and 4.58 range values within. There may still be a line of lower lows beneath the conjoined trend lines of the SMAs for some time before the emergence of a new upswing motion.
Note: Cryptosignals.org is not a financial advisor. Do your research before investing your funds in any financial asset or presented product or event. We are not responsible for your investing results.
You can purchase Lucky Block here. Buy LBLOCK