Dogecoin (DOGE/USD) Trade Tends a Retracement, Holding Above $0.14
Estimated Reading Time: 3 minutes
Don’t invest unless you’re prepared to lose all the money you invest. This is a high-risk investment and you are unlikely to be protected if something goes wrong. Take 2 minutes to learn more
Dogecoin Price Prediction – March 11
As there has been a significant reversal downward move from around the point of $0.20, it produced a crypto signal to denote that buyers are liable to not have smooth outward-upside breaking through of resistances, given that the crypto trade tends a retracement moving style, holding above the point of $0.14.
It would be psychologically ideal for long-position placers to be strategically approaching in their way of placing position orders. According to that hypothesis, several false pulldowns that couple with fast upward reversal crypto signals may result in steady upward pressures in the long-term running mode.
DOGE/USD Market
Key Levels:
Resistance levels: $0.20, $0.30, $0.40
Support levels: $0.14, $0.12, $0.10
DOGE/USD – Daily Chart
The DOGE/USD daily showcases that the crypto instrument tends to retrace, holding above the baseline of $0.14.
The stochastic oscillators are over a couple of times, positioning southerly to move closely to the line of 20. Taking a look at the indicators from the middle Bollinger Band shows that the critical baseline is going to be centered around the line of $0.14. 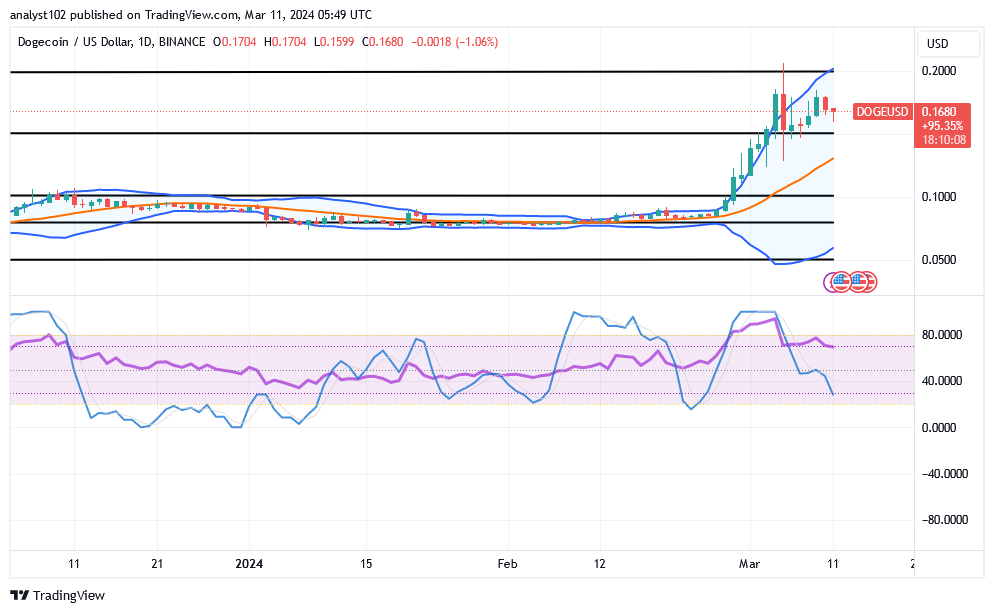
Is it possible that purchasers in the DOGE/USD market are unaware that the upper Bollinger Band is forming a shield above the price at the $0.20 mark?
A formation of a shielding outlook of the upper Bollinger Band indicator at a higher resistance spot like $0.20 will signify that price is going to relax for a while, blowing the point, given that the DOGE/USD market tends to retrace, holding above $0.14.
The market’s bulls will probably push back against any downward suspending moves that come from or above the middle Bollinger Band. Should the aforementioned situation come to pass, buyers will need to strengthen their comeback strategy.
Some pull-ups will be permitted to be paired with a signal of turning down that has to play out before launching a short-position order with the notion of exciting a stop-loss order in order to make sure that short-position pushers are on the safer side. Achieving that sentiment will take a lot of work because cryptocurrency economies are currently experiencing a bullish cycle.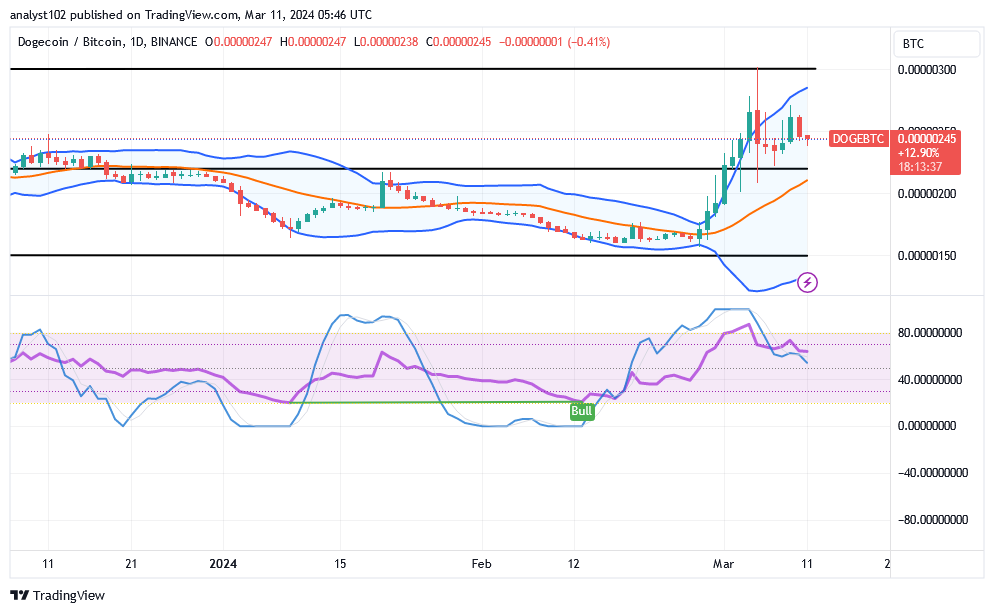
DOGE/BTC Price Analysis
In contrast, the Dogecoin market tends to retrace against the stance of Bitcoin, holding above the middle Bollinger Band indicator.
Using a pattern of movement, the stochastic oscillators have demonstrated that significant rejections of price actions have begun to occur at a specific higher resistance zone. With ideal bearish candlesticks, the upper Bollinger Band trend lines are attempting to bend southward, indicating that pushers in long positions should exercise caution. Most indications that the price will enter a long-term, free-driven downward path will be invalidated if the oscillators are repositioned at lower ends to the upside.
Note: Cryptosignals.org is not a financial advisor. Do your research before investing your funds in any financial asset or presented product or event. We are not responsible for your investing results.
You can purchase Lucky Block here. Buy LBLOCK