Dogecoin’s (DOGE/USD) Price Trades Sideways, Floating Above $0.060
Estimated Reading Time: 3 minutes
Don’t invest unless you’re prepared to lose all the money you invest. This is a high-risk investment and you are unlikely to be protected if something goes wrong. Take 2 minutes to learn more
Dogecoin Price Prediction – September 4
Some pushes have initially surfaced to the downside of the market operations involving Dogecoin and the US Dollar as the crypto’s price trades sideways below its indicators, floating above the line of $0.060 at a close-range spot.
Over time, the major resistance line of $0.070 has been under negotiation between the crypto economy and the fiat currency. In the interim, the price needs to be stopped from starting a free slide around the $0.060 mark. Investors will need to start their dip purchasing strategy during the course of that supposition in order to get in front of any potential rebounding move that may occur in the near future.
DOGE/USD Market
Key Levels:
Resistance levels: $0.070, $0.075, $0.085
Support levels: $0.055, $0.050, $0.045
DOGE/USD – Daily Chart
The DOGE/USD daily reveals the crypto-economic price is in a sideways trade cycle beneath the trend line of the smaller SMA, floating above $0.060 at a near-range spot.
The 14-day SMA indicator is underneath the 50-day SMA indicator. And they are featured at the top points of the candlesticks. The stochastic oscillators are in a southbound-crossing manner from around the value of 80 to stay between 52.31 and 50.96 values, implying that a line of indecision may play out for some time.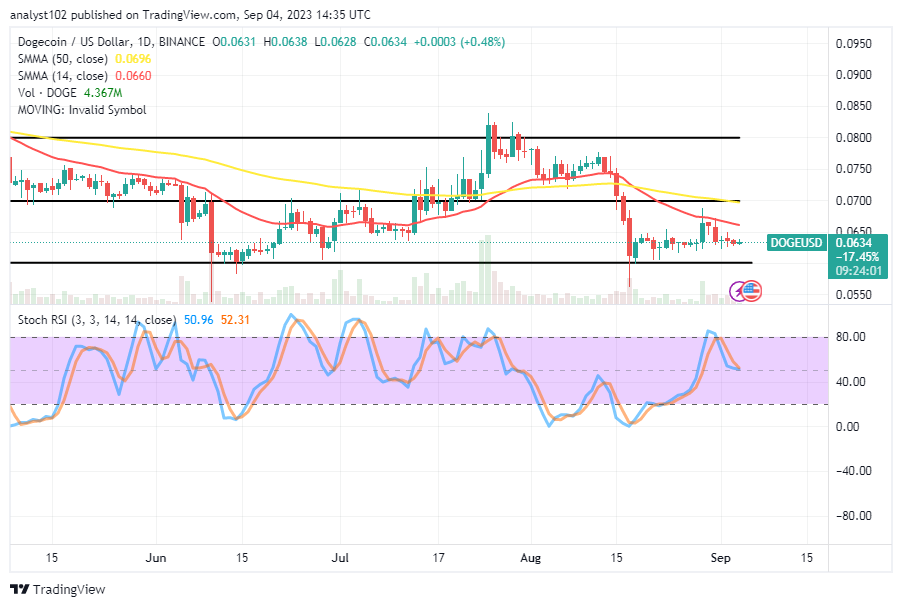
Should sellers in the DOGE/USD market operations continue to short positions below the smaller SMA?
At this point, every entry aiming in a direction should be guided by the principle of active price action, as the DOGE/USD market is moving sideways, floating above the line of $0.060.
The market’s impulse signal is currently rated poorly because we’re waiting for a scenario in which the stochastic oscillators will shift their position to lower-range trading points, therefore indicating a favorable purchasing opportunity. Nevertheless, traders may increase their positions from the current level even if the price must still decline for the market to function over the long term.
When the price is testing a resistance area around its SMAs and a string of rejection symbols is catching up with it, short-position pushers may receive a strong sell entry. The ideal scenario would be for bears to avoid any bounces that the shifting aftermath situation would produce.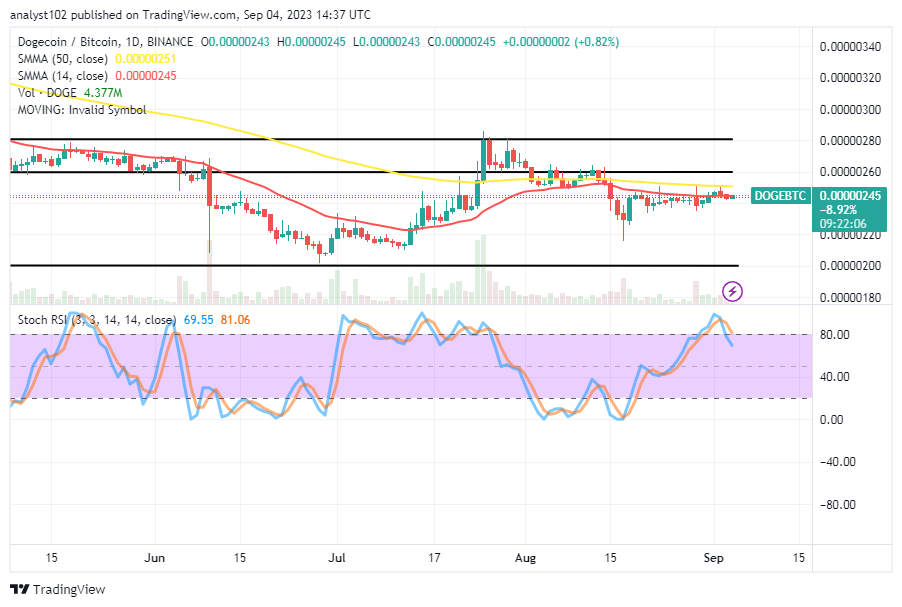
DOGE/BTC Price Analysis
In contrast, Dogecoin’s price is moving sideways against Bitcoin, basically around the trend lines of the smaller SMA, floating above the horizontal line drawn beneath the indicators.
Compared to the 50-day SMA indicator, the 14-day SMA indicator is lower. Pushes to the upside may not be in smoothies, according to the stochastic oscillators’ mild southward placement, which has been seen at a higher range. However, the base trade instrument might potentially resist a complete free reduction path. The movements may run in different ranges instead.
Note: Cryptosignals.org is not a financial advisor. Do your research before investing your funds in any financial asset or presented product or event. We are not responsible for your investing results.
You can purchase Lucky Block here. Buy LBLOCK