Ethereum (ETH) Is in a Sideways Move, Unable to Break Resistance at $3,640
Estimated Reading Time: 2 minutes
Don’t invest unless you’re prepared to lose all the money you invest. This is a high-risk investment and you are unlikely to be protected if something goes wrong. Take 2 minutes to learn more

Ethereum Price Long-Term Analysis: Bullish
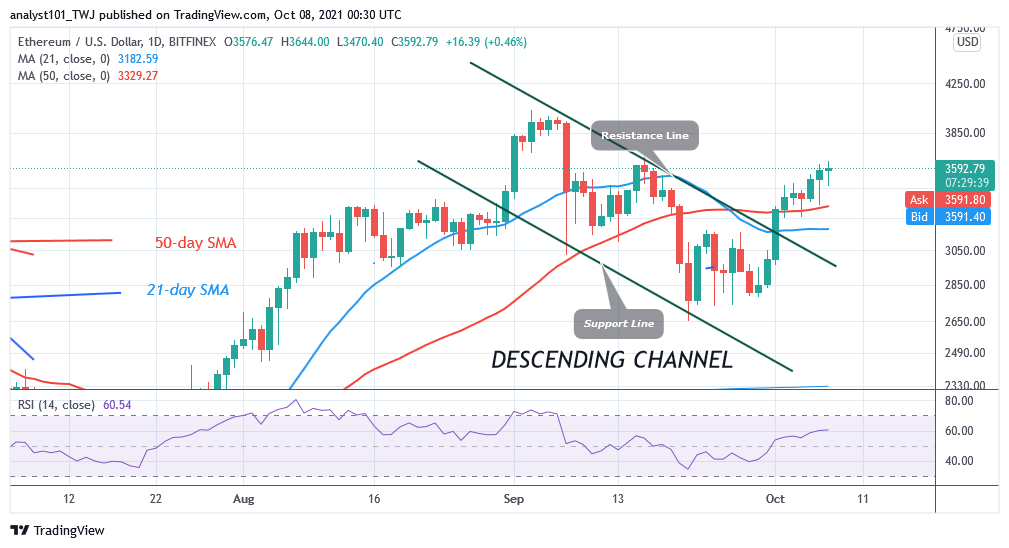
Ethereum (ETH) price has continued to rally on the upside after breaking above the moving averages. The biggest altcoin is facing resistance at the $3,640 high. On September 16, the bulls could not penetrate the resistance at $3,640 as the altcoin was repelled. Ether declined to a $2,656 low and resumed a fresh uptrend. On the upside, a break above $3,640 resistance will push the altcoin to the high of $4,100.
Ethereum Indicator Analysis
The altcoin is at level 60 of the Relative Strength Index period 14. It indicates that the market is in the uptrend zone and above the centerline 50. Ether is above the 80% range of the daily stochastic. The market has reached the overbought region. In a strong trending market, the overbought condition may not hold.
Technical indicators:
Major Resistance Levels – $2, 600, $2,800, $3,000
Major Support Levels – $1.500, $1, 300, $1,100
What Is the Next Direction for Ethereum?
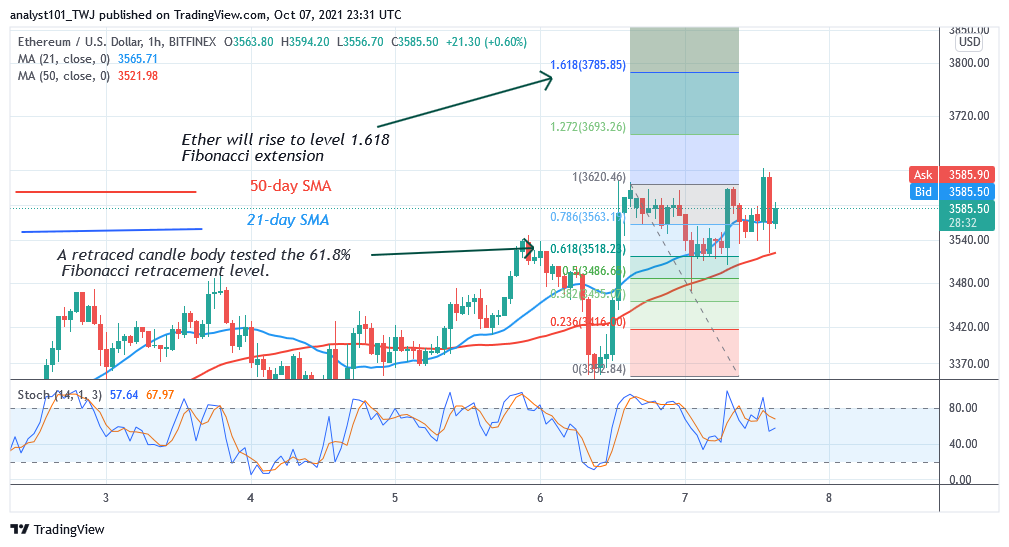
On the 4- hour chart, Ether has resumed upward move. On October 6, the first uptrend was resisted at the high of $3,640. Later, Ethereum was compelled to a sideways move below the resistance level. For the past 48 hours, the bulls have failed to breach the recent high. Meanwhile, on October 6 uptrend; a retraced candle body tested the 61.8% Fibonacci retracement level. The retracement indicates that Ether will rise to level 1.618 Fibonacci extension or
$3,785.85.
You can purchase crypto coins here. Buy Tokens
Note: Cryptosignals.org is not a financial advisor. Do your research before investing your funds in any financial asset or presented product or event. We are not responsible for your investing results